Introduction
The growing threat of antimicrobial resistance (AMR) is a leading patient health and safety issue, with estimates that AMR will be responsible for more than 10 million deaths by 2050. A major driver of AMR has been the misuse of antimicrobials in humans. Whilst reasons for the misuse of antimicrobials are complex and multifaceted, a number of factors have been described and investigated. At the individual level, physicians often prioritise the management of the patient being treated, paying little regard to the long-term consequences of overusing antimicrobials. Moreover, the majority of antimicrobials are prescribed by individuals who are not experts in infection management and may have limited understanding of antimicrobials and the potential consequences of AMR.
For such reason, numerous health organizations have promoted antimicrobial surveillance to regulate prescriptions within clinical practice. At national level, Public Health England implemented the English surveillance program for antimicrobial utilisation and resistance (ESPAUR) which provides annual reports as a benchmark to determine appropriate local action. At international level, the European Centre for Disease Prevention and Control through the European antimicrobial resistance surveillance network (EARS-Net) has created the largest publicly funded system for antimicrobial surveillance in Europe. Furthermore, the World Health Organization has recently implemented the global antimicrobial resistance surveillance system (GLASS) to strengthen the evidence base on AMR and inform decision-making.
With increasing electronic recording of data, there is a growing interest in the potential secondary use of microbiology records to provide the necessary information to support antimicrobial stewardship programs [20]. These programs are crucial to guide health care organizations designing evidence-based policies to combat AMR [21, 22]. In particular, susceptibility reporting has shown to be a determinant data source to inform empiric antimicrobial therapy selection.
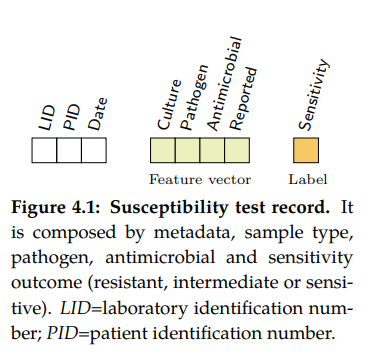
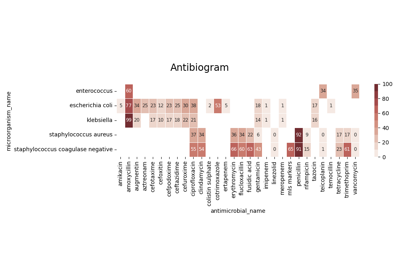
Susceptibility test records (see Figure 4.1) are composed by laboratory identification number (LID), patient identification number (PID), date, sample type or culture (e.g. blood or urine), pathogen, antimicrobial, reported status and outcome (resistant, sensitive or intermediate). In research, the susceptibility test data is usually first grouped by specimen or culture type, and further grouped by pairs (pathogen, antimicrobial) since it is widely accepted by clinicians as detailed in the UK five year strategy in AMR [21].
What is susceptibility testing?
Antimicrobial susceptibility testing or AST is a laboratory method used to determine the
effectiveness of antimicrobial agents against specific microorganisms. It helps in guiding
appropriate antimicrobial therapy by providing valuable information about the susceptibility
or resistance of bacteria, fungi, or other pathogens to different drugs. Several key concepts
are involved in this process:
Minimum Inhibitory Concentration (MIC): MIC is the lowest concentration of an antimicrobial agent that inhibits the visible growth of a microorganism. It provides a quantitative measure of the susceptibility of the organism to the drug.
Zone of Inhibition: This concept is specific to disc diffusion tests, where antimicrobial agents are applied to a culture plate and diffuse outward. The zone of inhibition is the area around the disc where microbial growth is inhibited due to the effectiveness of the drug.
Breakpoints: Breakpoints are predefined thresholds that categorize organisms as susceptible, intermediate, or resistant based on their MIC or zone of inhibition values. These breakpoints serve as guidelines for determining appropriate treatment options.
Quality Control: Quality control measures are essential to ensure the accuracy and reliability of antimicrobial susceptibility testing (AST). It involves testing reference strains with known susceptibility patterns to verify that the testing process is performing as expected.
Interpretive Criteria: Interpretive criteria are guidelines provided by regulatory bodies, such as the Clinical and Laboratory Standards Institute (CLSI) or the European Committee on Antimicrobial Susceptibility Testing (EUCAST). These criteria help interpret the test results and provide recommendations for appropriate antimicrobial therapy.
Overall, antimicrobial susceptibility testing (AST) plays a vital role in guiding the selection of appropriate antimicrobial agents, optimizing treatment outcomes, and combating antimicrobial resistance.
Let’s see in more detail some concepts related with AST.
Specimen
A microbiology specimen sample refers to a biological material or substance collected from a patient or the environment for laboratory analysis in the field of microbiology. These samples are collected to identify and study microorganisms, such as bacteria, viruses, fungi, and parasites, present in the specimen. Microbiology specimen samples play a crucial role in diagnosing and monitoring infectious diseases, identifying the causative agents, and guiding appropriate treatment strategies. In clinical specimens, these samples are collected from patients to diagnose and monitor infectious diseases. Common types of clinical microbiology specimen samples include:
Blood: A blood sample collected for blood cultures to identify bacteria or fungi causing bloodstream infections.
Urine: A urine sample collected for urinalysis and urine culture to detect urinary tract infections and identify the causative organisms.
Respiratory Specimens: These include sputum (mucus coughed up from the lungs), throat swabs, nasopharyngeal swabs, and bronchoalveolar lavage (BAL) samples. They are used to diagnose respiratory tract infections, such as pneumonia, tuberculosis, and influenza.
Stool: A stool sample collected for fecal analysis and culture to detect gastrointestinal infections, including bacterial, viral, or parasitic causes.
Wound Swabs: Swabs taken from infected wounds or abscesses to identify the bacteria or fungi causing the infection.
Genital Specimens: These include vaginal swabs, cervical swabs, urethral swabs, and genital ulcers. They are collected to diagnose sexually transmitted infections (STIs) and other genital infections.
Microorganism
A microorganism, or microbe, is an organism of microscopic size, which may exist in its single-celled form or as a colony of cells. Microbes are important in human culture and health in many ways, serving to ferment foods and treat sewage, and to produce fuel, enzymes, and other bioactive compounds. Microbes are essential tools in biology as model organisms and have been put to use in biological warfare and bioterrorism. Microbes are a vital component of fertile soil. In the human body, microorganisms make up the human microbiota, including the essential gut flora. The pathogens responsible for many infectious diseases are microbes and, as such, are the target of hygiene measures.
There are several approaches to categorizing infectious microorganisms. It’s important to note that these approaches are not mutually exclusive, and often multiple methods are used in combination to fully understand and categorize infectious microorganisms. Furthermore, advances in molecular techniques and genomics have provided new insights into the classification and identification of microorganisms, allowing for more precise categorization based on genetic characteristics.
Name |
Description |
Categories |
|---|---|---|
|
Taxonomic characteristics, such as their genetic makeup, morphology, and evolutionary relationships |
domain, kingdom, phylum, class, order, family, genus, species |
|
Refers to the shape and arrangement of bacterial cells including cocci (spherical), bacilli (rod-shaped), spirilla (spiral-shaped), and vibrios (comma-shaped) |
cocci, bacilli, vibrio, spirochete |
|
Helps identify the differences in the structure of the bacterial cell wall. |
positive, negative |
|
It plays a role in the clotting of plasma proteins. Coagulase-positive bacteria can cause the formation of fibrin clots, while coagulase-negative bacteria do not produce this enzyme. |
positive, negative |
|
Wehther require oxygen for growth and metabolism |
aerobic, anaerobic |
|
Whether they can derive energy through fermentation in the absence of oxygen, or oxidative, meaning they require oxygen for energy production. It is not universally performed by all microorganisms. |
lactose, non-lactose |
|
Refers to the ability of bacteria to lyse red blood cells |
alpha, beta, gamma, no-hemolysis |
|
||
|
||
|
Streptococcus is a diverse group of bacteria and the most common classification is the so-called Lancefield which groups bacterias based on the presence of specific carbohydrate antigens on their cell walls. |
A, B, C, D |
|
||
|
||
|
||
|
||
|
methods that allow microorganisms to move and navigate through their environments. |
flagellar, ciliary, amoeboid, gliding, tumbling/twitching, spore dispersal, passive |
|
How they spread from one host to another |
direct contact, indirect contact, airborn, vector-born, fecal-oral, vertical |
|
refers to an organism that provides a suitable environment and resources for the growth, survival, and reproduction of microorganisms |
human, animal, swine, cattle, … |
|
Whether their are found in the environment (soil bacteria or waterborne bacteria), whether they coexist with the host without causing harm (commensal) or cause a disease (pathogenic) |
environmental, commensal, pathogenic |
|
Note
These categories are for reference, most have not been used within the library.
Taxonomy

Bacterial taxonomy is a rank-based classification, of bacteria. In the scientific classification established by Carl Linnaeus, each species has to be assigned to a genus (binary nomenclature), which in turn is a lower level of a hierarchy of ranks (family, suborder, order, subclass, class, division/phyla, kingdom and domain). In the currently accepted classification of life, there are three domains (Eukaryotes, Bacteria and Archaea), which, in terms of taxonomy, despite following the same principles have several different conventions between them and between their subdivisions. See an example below.
life:
domain: Bacteria
kingdom:
phylum: Proteobacteria
class: Gamma Proteobacteria
order: Enterobacteriales
family: Enterobacteriaceae
genus: Escherichia
species: Escherichia coli
subspecies (missing in dataset)
Shape or morphology
ROS1: Microbial morphology.
Different types of microbes have different, but characteristic, shapes. Under suitable conditions, the shape and size of microbes are relatively stable. It is important to know the morphological structure of microbes, as it provides us with a better understanding of microbial physiology, pathogenic mechanisms, antigenic features, and allows us to identify them by species. In addition, knowledge of microbial morphology can be helpful in diagnosing disease and in preventing microbial infections.
Bacteria are complex and highly variable microbes. They come in four basic shapes: spherical (cocci), rod-shaped (bacilli), arc-shaped (vibrio), and spiral (spirochete). See some examples included in the figure below.
Gram Stain
Gram stain or Gram staining, also called Gram’s method, is a method of staining used to distinguish and classify bacterial species into two large groups according to the chemical and physical properties of their cell walls: gram-positive bacteria and gram-negative bacteria. The name comes from the Danish bacteriologist Hans Christian Gram, who developed the technique.
Gram positive bacteria take up the crystal violet stain used in the test, and then appear to be purple-coloured when seen through an optical microscope. This is because the thick peptidoglycan layer in the bacterial cell wall retains the stain after it is washed away from the rest of the sample, in the decolorization stage of the test.
Gram-negative bacteria cannot retain the violet stain after the decolorization step; alcohol used in this stage degrades the outer membrane of gram-negative cells, making the cell wall more porous and incapable of retaining the crystal violet stain. Their peptidoglycan layer is much thinner and sandwiched between an inner cell membrane and a bacterial outer membrane, causing them to take up the counterstain (safranin or fuchsine) and appear red or pink.
Note
Despite their thicker peptidoglycan layer, gram-positive bacteria are more receptive to certain cell wall–targeting antibiotics than gram-negative bacteria, due to the absence of the outer membrane.
Coagulase Production
Coagulase is a protein enzyme produced by several microorganisms that enables the conversion of fibrinogen to fibrin. In the laboratory, it is used to distinguish between different types of Staphylococcus isolates. Importantly, S. aureus is generally coagulase-positive, meaning that a positive coagulase test would indicate the presence of S. aureus or any of the other 11 coagulase-positive Staphylococci. A negative coagulase test would instead show the presence of coagulase-negative organisms such as S. epidermidis or S. saprophyticus. However, it is now known that not all S. aureus are coagulase-positive. Whereas coagulase-positive Staphylococci are usually pathogenic, coagulase-negative Staphylococci are more often associated with opportunistic infection.
Oxygen requirements
The two main types of bacterial growth are aerobic and anaerobic. The basic difference between the two, is that the former thrives in oxygenated environment and latter in an environment marked by the absence of oxygen, there also exist other differences which cannot be ignored.
Aerobic: These are the species of bacteria which require oxygen for their basic survival, growth, and the process of reproduction. It is very easy to isolate these bacteria by culturing a mass of bacterial strains in some liquid medium. As they require oxygen for survival, they tend to come to the surface in a bid to derive maximum oxygen available. Examples are Bacillus or Nocardia.
Anaerobic: these are the species of bacteria which don’t require oxygen for growth. There are different types of anaerobic species, including the aerotolerant anaerobes, which can survive in the presence of oxygen, and obligate anaerobes, which can’t survive in the presence of oxygen. Examples are Escherichia coli or Bacteroides.
Haemolysis
Hemolysis (from Greek αιμόλυση, meaning ‘blood breakdown’) is the breakdown of red blood cells. The ability of bacterial colonies to induce hemolysis when grown on blood agar is used to classify certain microorganisms. This is particularly useful in classifying streptococcal species. A substance that causes hemolysis is a hemolysin.
Alpha-hemolysis: When alpha-hemolysis (α-hemolysis) is present, the agar under the colony is light and greenish. Streptococcus pneumoniae and a group of oral streptococci (Streptococcus viridans or viridans streptococci) display alpha hemolysis.
Beta-hemolysis: Sometimes called complete hemolysis, is a complete lysis of red cells in the media around and under the colonies: the area appears lightened (yellow) and transparent. Streptolysin, an exotoxin, is the enzyme produced by the bacteria which causes the complete lysis of red blood cells. There are two types of streptolysin: Streptolysin O (SLO) and streptolysin S (SLS).
Gamma-hemolysis: If an organism does not induce hemolysis, the agar under and around the colony is unchanged, and the organism is called non-hemolytic or said to display gamma-hemolysis (γ-hemolysis). Enterococcus faecalis (formerly called “Group D Strep”), Staphylococcus saprophyticus, and Staphylococcus epidermidis display gamma hemolysis.
Streptococcus groups
When discussing Streptococcus, a genus of bacteria, the categorization typically refers to different groups or serotypes within the genus. Streptococcus is a diverse group of bacteria that are classified based on their cell wall composition, hemolytic activity (ability to lyse red blood cells), and specific antigenic properties.
The most common classification system for Streptococcus is the Lancefield classification, which groups the bacteria based on the presence of specific carbohydrate antigens on their cell walls. The Lancefield system assigns letters to different serological groups: Groups A, B, C, D, etc. These letters are determined by the reactions of the bacteria with specific antisera.
Here is a brief overview of the four groups you mentioned within the context of Streptococcus:
Group A Streptococcus (GAS): Group A streptococcus, also known as Streptococcus pyogenes, is associated with a wide range of human infections. It can cause conditions such as strep throat, impetigo (skin infection), cellulitis, necrotizing fasciitis (flesh-eating disease), and scarlet fever.
Group B Streptococcus (GBS): Group B streptococcus, also known as Streptococcus agalactiae, is commonly found in the gastrointestinal and genital tracts of healthy adults. However, it can cause serious infections in newborns, pregnant women, and individuals with weakened immune systems. GBS is a leading cause of sepsis, pneumonia, and meningitis in newborns.
Group C Streptococcus: Group C streptococcus comprises several different species within the genus Streptococcus that share certain antigenic characteristics. Some strains of Group C streptococcus can cause human infections, including respiratory tract infections, skin and soft tissue infections, and invasive diseases.
Group D Streptococcus: Group D streptococcus includes various species, such as Streptococcus faecalis and Streptococcus faecium. These bacteria are part of the normal flora of the human gastrointestinal tract. However, they can also cause infections, particularly in individuals with underlying health conditions. Group D streptococci are associated with infections such as urinary tract infections, endocarditis (infection of the heart valves), and intra-abdominal infections.
It’s important to note that there are other serogroups and species within the genus Streptococcus, each with its own unique characteristics and disease associations.
Mobility
Microorganisms exhibit various types of mobility that allow them to move and navigate through their environments. Here are some common types of microorganism mobility:
Flagellar Mobility: Many bacteria possess whip-like appendages called flagella that enable them to move. These flagella can rotate, allowing the microorganism to propel itself through liquid environments such as water or mucus.
Ciliary Mobility: Some microorganisms, particularly certain protozoa and certain types of algae, have numerous tiny hair-like structures called cilia. Coordinated beating of these cilia creates a wave-like motion, allowing the microorganism to move through liquids.
Amoeboid Movement: Amoebas and certain types of other protozoa exhibit amoeboid movement. They extend and retract pseudopods, which are temporary bulges or projections of the cell membrane. By changing the shape of their bodies, they can crawl or ooze along surfaces.
Gliding: Some bacteria and algae exhibit gliding motility, which involves smooth, continuous movement across surfaces. The exact mechanisms of gliding are not fully understood, but they may involve secretion of slime or other surface interactions.
Tumbling and Twitching: Certain bacteria, such as Escherichia coli, use a combination of tumbling and twitching for movement. Tumbling involves a change in direction by randomly reorienting their flagella, while twitching involves the extension, attachment, and retraction of pili (thin, hair-like structures) to pull the cell along surfaces.
Spore Dispersal: Fungi and some bacteria produce spores as a means of dispersal. These spores can be carried by wind, water, or animals to colonize new environments.
Passive Movement: Some microorganisms rely on external factors like air or water currents to carry them to new locations. They may possess adaptations such as lightweight structures or structures that facilitate floating to aid in passive dispersal.
It’s important to note that not all microorganisms are motile. Some microorganisms, such as certain bacteria and fungi, are non-motile and rely on other means of dispersal, such as wind, water, or the movement of other organisms.
Transmission
Microorganisms can be transmitted through various routes or modes of transmission. The primary modes of transmission include:
Direct Contact: Transmission occurs through direct physical contact between an infected individual and a susceptible person. This can involve touching, kissing, sexual contact, or contact with infected bodily fluids or lesions.
Indirect Contact: Transmission occurs indirectly through contact with contaminated surfaces, objects, or fomites. Examples include touching a doorknob, using contaminated utensils, or sharing personal items like towels or razors.
Respiratory Droplets: Transmission occurs when an infected person coughs, sneezes, talks, or breathes, releasing respiratory droplets containing microorganisms into the air. These droplets can be inhaled by nearby individuals, leading to infection. Diseases such as influenza, common cold, and COVID-19 can be transmitted through respiratory droplets.
Airborne Transmission: Microorganisms can remain suspended in the air for longer periods and can be inhaled over longer distances. Airborne transmission typically involves smaller particles or droplet nuclei that can carry infectious agents, such as tuberculosis bacteria or certain fungal spores.
Vector-borne Transmission: Certain microorganisms are transmitted through vectors, which are living organisms that can carry and transmit pathogens. Vectors include mosquitoes (e.g., malaria, dengue fever), ticks (e.g., Lyme disease), fleas (e.g., plague), and flies (e.g., sleeping sickness).
Fecal-Oral Transmission: Microorganisms can be transmitted when fecal matter from an infected individual contaminates food, water, or surfaces, and is subsequently ingested by another person. This transmission route is common for diseases such as cholera, hepatitis A, and norovirus.
Vertical Transmission: Microorganisms can be transmitted from an infected mother to her child during pregnancy, childbirth, or breastfeeding. This mode of transmission can occur for certain viruses like HIV, hepatitis B, and Zika virus.
It’s important to note that the modes of transmission can vary depending on the specific microorganism and the disease it causes. Public health measures such as hand hygiene, respiratory etiquette, proper food and water handling, vector control, and vaccination are crucial in preventing the transmission of microorganisms and controlling infectious diseases.
Antimicrobial
An antimicrobial is an agent that kills microorganisms or stops their growth. Antimicrobial medicines can be grouped according to the microorganisms they act primarily against in for main categories: (i) anibiotics which are used against bacteria, (ii) antifungals which are used against fungi, (iii) antivirals which are used against viruses and (iv) antiparasitics which are used against parasites.

Antibiotics are powerful medications that are used to treat bacterial infections. They work by either killing the bacteria or inhibiting their growth, thereby helping the body’s immune system to overcome the infection. There are various types of antibiotics, each with its own mechanism of action and spectrum of activity. Here’s an brief introduction to some of the different types of antibiotics:
Penicillins: Penicillins were the first antibiotics discovered and are still widely used today. They work by interfering with the synthesis of bacterial cell walls, leading to their destruction. Examples of penicillins include amoxicillin and ampicillin.
Cephalosporins: Cephalosporins are similar to penicillins in their mechanism of action. They also disrupt bacterial cell wall synthesis, but they have a broader spectrum of activity and are often used as an alternative to penicillins. Examples of cephalosporins include cephalexin and ceftriaxone.
Macrolides: Macrolides are a class of antibiotics that inhibit bacterial protein synthesis. They bind to the bacterial ribosome, preventing the synthesis of new proteins. Macrolides are effective against many different types of bacteria and are often used to treat respiratory tract infections. Examples of macrolides include erythromycin and azithromycin.
Tetracyclines: Tetracyclines are broad-spectrum antibiotics that inhibit protein synthesis in bacteria. They are often used to treat acne and respiratory tract infections. Tetracycline and doxycycline are examples of tetracycline antibiotics.
Fluoroquinolones: Fluoroquinolones work by interfering with bacterial DNA replication and repair. They are effective against a wide range of bacteria and are commonly used to treat urinary tract infections and respiratory infections. Ciprofloxacin and levofloxacin are examples of fluoroquinolones.
Sulfonamides: Sulfonamides, also known as sulfa drugs, inhibit the synthesis of folic acid in bacteria, which is essential for their growth. They are used to treat urinary tract infections, respiratory infections, and other bacterial infections. Examples of sulfonamides include sulfamethoxazole and trimethoprim.
Aminoglycosides: Aminoglycosides are bactericidal antibiotics that inhibit bacterial protein synthesis. They are particularly effective against aerobic gram-negative bacteria. Aminoglycosides are often used in combination with other antibiotics to treat severe infections. Gentamicin and streptomycin are examples of aminoglycosides.

These are just a few examples of the different types of antibiotics available. It’s important to note that the choice of antibiotic depends on the specific infection being treated, as well as factors such as the type of bacteria involved, the site of infection, and the patient’s individual circumstances. Antibiotics should always be used judiciously and under the guidance of a healthcare professional to ensure their appropriate and effective use.
RA1: Entry in wikipedia for Antibiotic.
Summary of AMR metrics
Establishing quantifiable metrics is essential to gain a standardized and objective framework to monitor the emergence and spread of resistant strains, assess the effectiveness of antimicrobial interventions, and evaluate the impact of various interventions and policies. Such metrics enable us to quantify resistance levels, track trends over time, and compare data across different regions and healthcare settings, facilitating evidence-based decision making. Furthermore, these metrics provide a foundation for the development of sophisticated algorithms that can analyze vast amounts of data, identify patterns, predict resistance patterns, and assist clinicians in making informed treatment choices. By integrating these metrics into clinical decision support systems, healthcare providers can access real-time, data-driven insights to optimize antimicrobial therapy, improve patient outcomes, and mitigate the further development and dissemination of antimicrobial resistance.
Name |
Range |
Description |
|
|---|---|---|---|
|
Single Antimicrobial Resistance Index |
[0, 1] |
Ratio of resistant isolates |
|
Multiple Antimicrobial Resistance Index |
[0, 1] |
Ratio of agents tested to which a pathogen is resistant |
|
Single Antimicrobial Resistance Trend |
[0, 1] |
Ratio of change of resistance rates per time unit |
|
Antimicrobial Spectrum of Activity Index |
[-1, 1] |
Range of microbe species that are susceptible to an agent |
|
Antimicrobial Collateral Sensitivity Index |
[-.7, .7] |
Degree of dependence between two agents |
|
Drug Resistance Index |
[0, 1] |
Ratio of pathogens resistant to the antimicrobials used to treat them |
Single Antimicrobial Resistance (SARI)
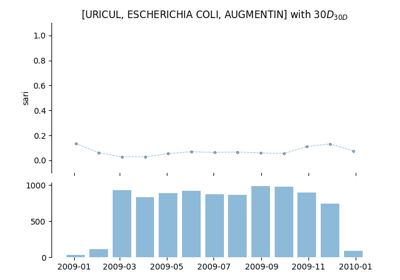
The single antimicrobial resistance index describes the proportion of resistant isolates for a given set of susceptibility tests. It provides a value within the range [0,1] where values close to one indicate high resistance. It is agnostic to pathogen, antibiotic and time. The variables R, I and S represent the number of susceptibility tests with Resistant, Intermediate and Susceptible outcomes respectively. The definition might vary slightly since the intermediate category is not always considered.
See: pyamr.core.sari.SARI
Multiple Antimicrobial Resistance
The multiple antimicrobial resistance describes the ratio of antimicrobials tested (T) to which a pathogen is resistant (R). It provides a value within the range [0,1] where values close to one indicate high multi-drug resistance. It highly depends on the antimicrobials to which the pathogen is tested. Since tested antimicrobials vary among health care centres and time, comparison and analysis of its evolution in time is not straight forward. In addition, antibiotics which are intrinsically resistant should not be considered.
See: pyamr.core.mari.MARI
Single Antimicrobial Resistance Trend
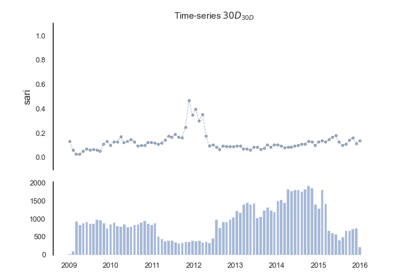
The single antimicrobial resistance trend measures the ratio of change per time unit (e.g. monthly or yearly). To compute this metric, it is necessary to generate a resistance time series from the susceptibility test data. This is often achieved by computing the SARI consecutive or overlapping partitions of the data. Then, the trend can be extracted using for example a linear model where the slope, which is a value within the range [-1, 1] indicates the ratio of change.
See: pyamr.core.sart.SART
Antimicrobial Spectrum of Activity
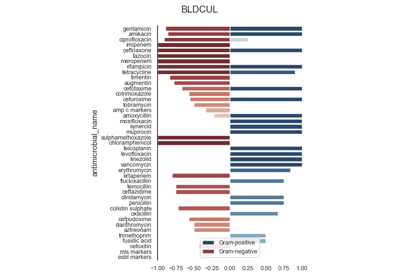
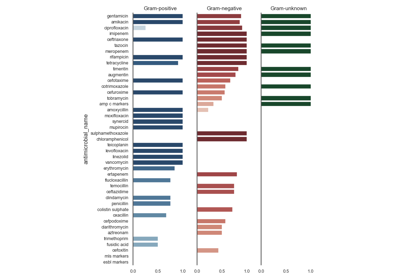
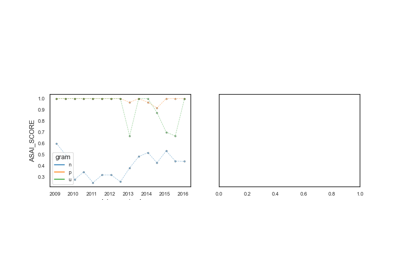
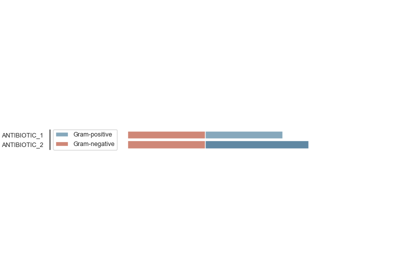
The antimicrobial spectrum of activity index refers to the range of microbe species that are susceptible to these agents and therefore can be treated. In general, antimicrobial agents are classified into broad, intermediate or narrow spectrum. Broad spectrum antimicrobials are active against both Gram-positive and Gram-negative bacteria. In contrast, narrow spectrum antimicrobials have limited activity and are effective only against particular species of bacteria.
See: pyamr.core.asai.ASAI
Antimicrobial Collateral Sensitivity
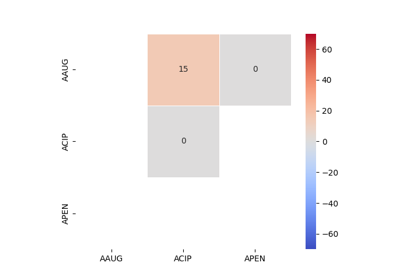
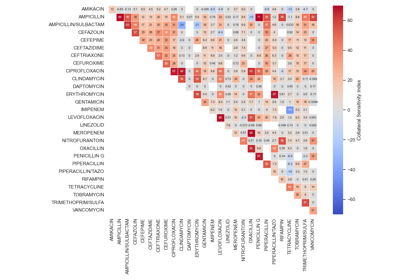
The antimicrobial collateral sensitivity index is based on the mutual information score and is useful to identify antibiotic pairs displaying concurrent resistance, independence, or disjoint resistance. Mutual information quantifies the degree of dependence between two antibiotic susceptibility test results (X and Y) by measuring the amount of information gained about one test result (X) by knowing that of the other (Y). Susceptibility test results for pairs of antibiotics (X/Y) belong to one of four possible states: susceptible/susceptible, susceptible/resistant, resistant/susceptible, or resistant/resistant. Concurrent resistance manifests as an X/Y bias toward susceptible/susceptible and resistant/resistant states, resulting in a positive MIS. Conversely, an X/Y bias toward susceptible/resistant and resistant/susceptible due to disjoint resistance would result in a negative MIS. The MIS is maximised (0·7) when susceptibility to one antibiotic always predicts susceptibility to another antibiotic and similarly for non-susceptibility. The MIS is minimised (−0·7) when resistance to one antibiotic always predicts susceptibility to another and vice versa.
See: pyamr.core.acsi.ACSI
Drug Resistance Index (DRI)
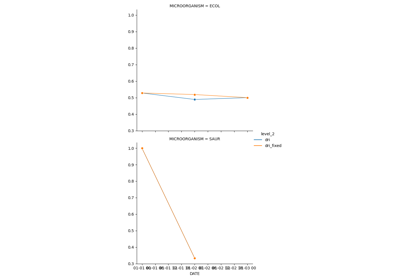
The drug resistance index measures the proportion of pathogens that are resistant to the antimicrobials used to treat them. It provides a value within the range [0,1] where values close to one indicate high resistant for frequent antimicrobials. The variable ρik is the proportion of resistance among organism i to antimicrobial k and qik is the frequency of drug k used to treat organism i.
See: pyamr.core.dri.DRI
Concepts for time series analysis
Time series analysis is a specific way of analyzing a sequence of data points collected over an interval of time. In time series analysis, analysts record data points at consistent intervals over a set period of time. Time series analysis typically requires a large number of data points to ensure consistency and reliability. An extensive data set ensures you have a representative sample size and that analysis can cut through noisy data. It also ensures that any trends or patterns discovered are not outliers and can account for seasonal variance. Additionally, time series data can be used for forecasting—predicting future data based on historical data.
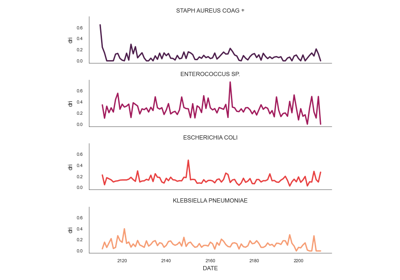
Examples using time-series analysis in pyAMR.
In time-series analysis, it is necessary to understand various statistical properties/tests in order to assess which method to use and to better understand the behaviour of the produced models. A summary of these statistical properties/tests is presented below.
Statistical properties
A statistic (singular) or sample statistic is any quantity computed from values in a sample which is considered for a statistical purpose. Some of the most commonly used descriptive statistics are central tendency, dispersion, skewness, and tailednes.
Name |
Description |
Range |
Choose |
|---|---|---|---|
|
Measures linear correlation between variables |
[-1, 1] |
≈0 |
|
Measure of tailedness of a probability distribution |
[1, ∞) |
≈0 |
|
Measure of asymmetry of a probability distribution |
≈0 |
|
|
Measures goodness-of-fit or linear regression models |
[0, 100] |
↑ |
|
Measures goodness-of-fit among models |
↓ |
|
|
Measures goodness-of-fit among models |
↓ |
|
|
Measures goodness-of-fit among models |
||
|
Pearson
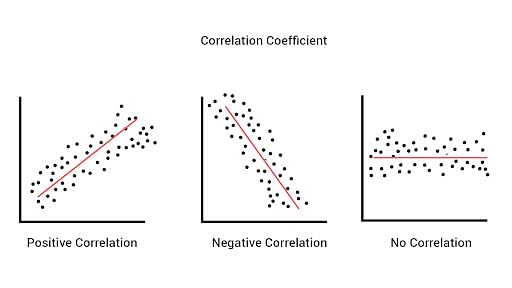
In statistics, the Pearson correlation coefficient is a measure of linear correlation between two sets of data. It is the ratio between the covariance of two variables and the product of their standard deviations; thus, it is essentially a normalized measurement of the covariance, such that the result always has a value between −1 and 1. The measure can only reflect a linear correlation of variables, and ignores many other types of relationships or correlations.
Kurtosis

Kurtosis describes the extent to which the tails (or extremes) of a set of data differ from those of a normal distribution. A bell curve distribution would exhibit kurtosis of 3, so only numbers above or below 3 can be described as “excess” Kurtosis.
It is common to compare the excess kurtosis (defined below) of a distribution to 0, which is the excess kurtosis of any univariate normal distribution. Distributions with negative excess kurtosis are said to be platykurtic, although this does not imply the distribution is “flat-topped” as is sometimes stated. Rather, it means the distribution produces fewer and/or less extreme outliers than the normal distribution. An example of a platykurtic distribution is the uniform distribution, which does not produce outliers. Distributions with a positive excess kurtosis are said to be leptokurt.
Skewness
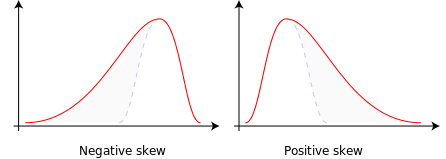
Skewness is a measure of the asymmetry of the probability distribution of a real-valued random variable about its mean. The skewness value can be positive, zero, negative, or undefined.
For a unimodal distribution, negative skew commonly indicates that the tail is on the left side of the distribution, and positive skew indicates that the tail is on the right. In cases where one tail is long but the other tail is fat, skewness does not obey a simple rule. For example, a zero value means that the tails on both sides of the mean balance out overall; this is the case for a symmetric distribution, but can also be true for an asymmetric distribution where one tail is long and thin, and the other is short but fat.
R2
R-squared is a goodness-of-fit measure for linear regression models. This statistic indicates the percentage of the variance in the dependent variable that the independent variables explain collectively. R-squared measures the strength of the relationship between your model and the dependent variable on a convenient 0 – 100% scale. R-squared is always between 0 and 100% where (i) 0% represents a model that does not explain any of the variation in the response variable around its mean. The mean of the dependent variable predicts the dependent variable as well as the regression model and (ii) 100% represents a model that explains all the variation in the response variable around its mean.
Akaike information criterion
The Akaike information criterion (AIC) is an estimator of prediction error and thereby relative quality of statistical models for a given set of data.[1][2][3] Given a collection of models for the data, AIC estimates the quality of each model, relative to each of the other models. Thus, AIC provides a means for model selection.
Bayesian information criterion
In statistics, the Bayesian information criterion (BIC) or Schwarz information criterion (also SIC, SBC, SBIC) is a criterion for model selection among a finite set of models; models with lower BIC are generally preferred. It is based, in part, on the likelihood function and it is closely related to the Akaike information criterion (AIC).
Hannan-Quinn information criterion
The Hannan-Quinn information criterion (HQC) is a measure of the goodness of fit of a statistical model, and is often used as a criterion for model selection among a finite set of models. It is not based on log-likelihood function (LLF), and but related to Akaike’s information criterion.
Stationarity
Statistical tests
A statistical test provides a mechanism for making quantitative decisions about a process or processes. The intent is to determine whether there is enough evidence to “reject” a conjecture or hypothesis about the process. The conjecture is called the null hypothesis.
Name |
Description |
Range |
Choose |
|---|---|---|---|
|
Goodness-of-fit measure data matches normal dist |
↓? |
|
|
Measure correlation of residuals in regression |
[0, 4] |
≈2 |
|
↓? |
||
|
|||
|
|||
|
|||
|
|||
|
|||
|
|||
|
Augmented Dicker-Fuller
Kendall
See: pyamr.core.stats.kendall.KendalWrapper
Kwiatkowski–Phillips–Schmidt–Shin
See: pyamr.core.stats.kpss.KPSSWrapper
Jarque Bera
In statistics, the Jarque–Bera test is a goodness-of-fit test of whether sample data have the skewness and kurtosis matching a normal distribution.
Durbin Watson
The Durbin Watson (DW) statistic is a test for autocorrelation in the residuals from a statistical model or regression analysis. The Durbin-Watson statistic will always have a value ranging between 0 and 4. A value of 2.0 indicates there is no autocorrelation detected in the sample.
Normal
Warning
Pending!
Kolmogorov-smirnov
Warning
Pending!
Shapiro-wilkinson
Warning
Pending!
Anderson-darling
Warning
Pending!
Omnibus
It’s important to note that the term “omnibus statistical test” is not limited to a specific statistical method or test but rather refers to a general concept of assessing the overall significance of a set of variables or factors collectively. The specific statistical test used as an omnibus test may vary depending on the research design, data type, and analysis objectives.
They test whether the explained variance in a set of data is significantly greater than the unexplained.
Warning
Pending!
