Examples with indexes

Todo

Create sub-galleries for each of the indexes when the number of samples grow.

The examples presented in the gallery below show examples to compute different antimicrobial resistance (AMR) indexes and possible ways to visualize the outcomes.

  • SARI: Single Antimicrobial Resistance Index

  • MARI: Multiple Antimicrobial Resistance Index

  • ASAI: Antibimicrobial Spectrum of Activity Index

  • SART: Single Antimicrobial Resistance Trend
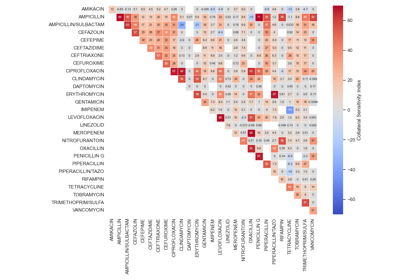
ACSI - Example using MIMIC

ACSI - Example using MIMIC

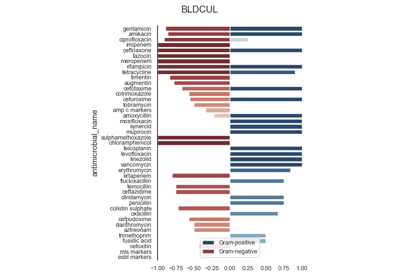
ASAI - By gram stain (binary)

ASAI - By gram stain (binary)

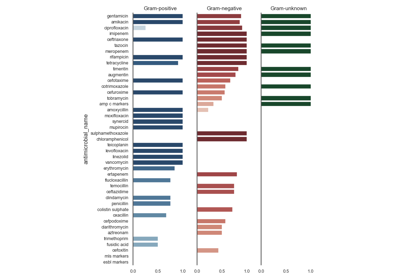
ASAI - By gram stain (multiple)

ASAI - By gram stain (multiple)

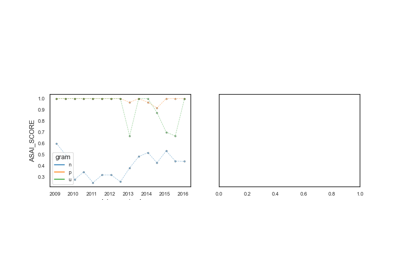
ASAI - Compute timeseries

ASAI - Compute timeseries

DRI - Example using MIMIC

DRI - Example using MIMIC

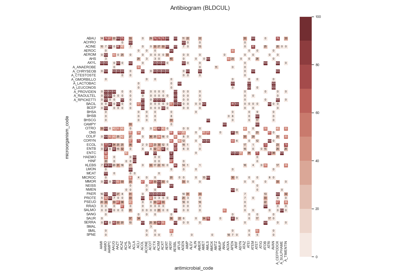
SARI - By specimen w/ sns.heatmap

SARI - By specimen w/ sns.heatmap

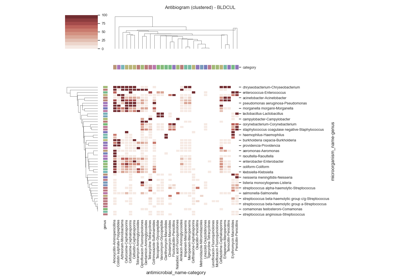
SARI - By specimen w/ sns.clustermap

SARI - By specimen w/ sns.clustermap

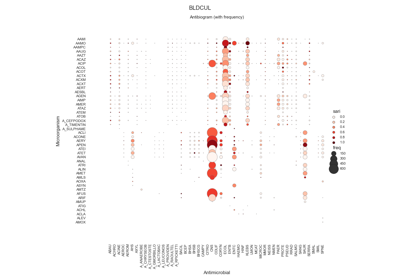
SARI - By specimen w/ sns.relmap

SARI - By specimen w/ sns.relmap

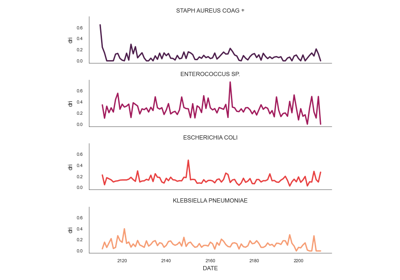
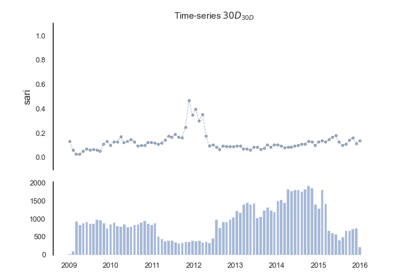
SARI - Compute timeseries

SARI - Compute timeseries

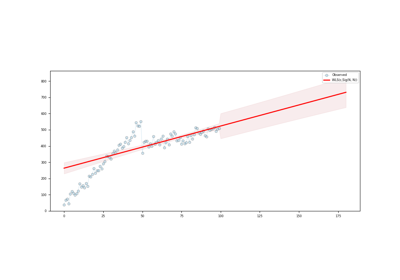
SART - Trend as slope of WLS

SART - Trend as slope of WLS

Gallery generated by Sphinx-Gallery