Note
Go to the end to download the full example code
Spectrum of Activity (ASAI)
Warning
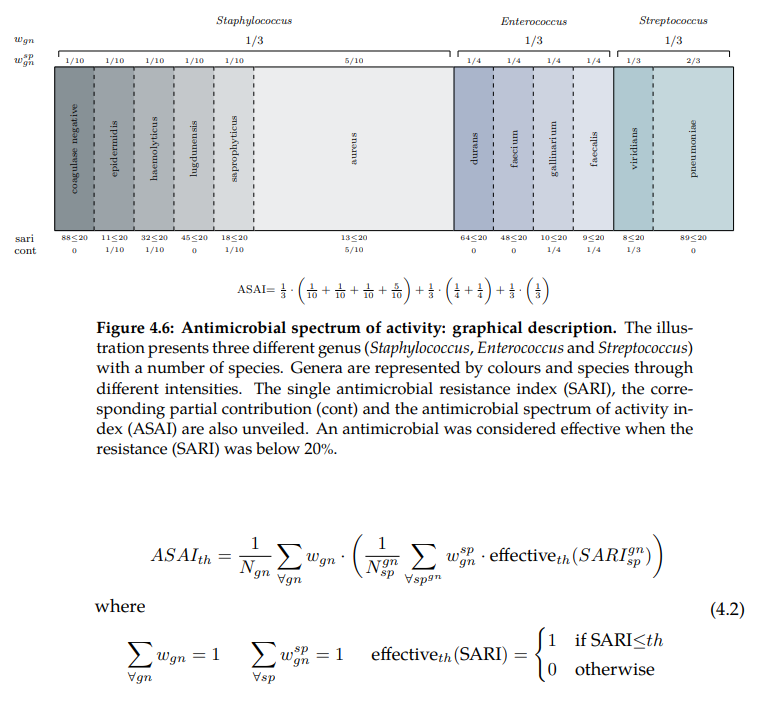
There is an error in the Figure displayed below. The contribution (cont) value for Staphylococcus haemolyticus should be 0 instead of 1/10 because the sari index is higher than the threshold (32 > 20) and therefore the antimicrobial is not considered effective.
The Antimicrobial Spectrum of Activity Index or ASAI refers to the range of microbe species that are
susceptible to these agents and therefore can be treated. In general, antimicrobial agents
are classified into broad, intermediate or narrow spectrum. Broad spectrum antimicrobials
are active against both Gram-positive and Gram-negative bacteria. In contrast, narrow
spectrum antimicrobials have limited activity and are effective only against particular
species of bacteria. While these profiles appeared in the mid-1950s, little effort has been
made to define them. Furthermore, such ambiguous labels are overused for different
and even contradictory purposes.
For more information see: pyamr.core.asai.ASAI

28 # Import libraries
29 import sys
30 import pandas as pd
31 import numpy as np
32 import seaborn as sns
33 import matplotlib as mpl
34 import matplotlib.pyplot as plt
35
36 # Import specific libraries
37 from pyamr.core.asai import ASAI
38 from pyamr.datasets.load import fixture
39 from pyamr.utils.plot import scalar_colormap
40
41 # Configure seaborn style (context=talk)
42 sns.set(style="white")
43
44 # Set matplotlib
45 mpl.rcParams['xtick.labelsize'] = 9
46 mpl.rcParams['ytick.labelsize'] = 9
47 mpl.rcParams['axes.titlesize'] = 11
48 mpl.rcParams['legend.fontsize'] = 9
49
50 # Pandas configuration
51 pd.set_option('display.max_colwidth', 40)
52 pd.set_option('display.width', 300)
53 pd.set_option('display.precision', 4)
54
55 # Numpy configuration
56 np.set_printoptions(precision=2)
57
58
59 # ---------------------
60 # Create data
61 # ---------------------
62 # Load data
63 dataframe = fixture(name='fixture_04.csv')
64
65 # Show
66 print("Summary:")
67 print(dataframe)
Summary:
             GENUS              SPECIE    ANTIBIOTIC GRAM  RESISTANCE  FREQUENCY  THRESHOLD  W_SPECIE  W_GENUS
0   Staphylococcus  coagulase negative  ANTIBIOTIC_1    P        0.88          1        0.2    0.1000   0.3333
1   Staphylococcus         epidermidis  ANTIBIOTIC_1    P        0.11          1        0.2    0.1000   0.3333
2   Staphylococcus        haemolyticus  ANTIBIOTIC_1    P        0.32          1        0.2    0.1000   0.3333
3   Staphylococcus         lugdumensis  ANTIBIOTIC_1    P        0.45          1        0.2    0.1000   0.3333
4   Staphylococcus       saporphyticus  ANTIBIOTIC_1    P        0.18          1        0.2    0.1000   0.3333
5   Staphylococcus              aureus  ANTIBIOTIC_1    P        0.13          5        0.2    0.5000   0.3333
6     Enterococcus              durans  ANTIBIOTIC_1    N        0.64          1        0.2    0.2500   0.3333
7     Enterococcus             faecium  ANTIBIOTIC_1    N        0.48          1        0.2    0.2500   0.3333
8     Enterococcus         gallinarium  ANTIBIOTIC_1    N        0.10          1        0.2    0.2500   0.3333
9     Enterococcus            faecalis  ANTIBIOTIC_1    N        0.09          1        0.2    0.2500   0.3333
10   Streptococcus           viridians  ANTIBIOTIC_1    P        0.08          1        0.2    0.3333   0.3333
11   Streptococcus          pneumoniae  ANTIBIOTIC_1    P        0.89          2        0.2    0.6667   0.3333
12  Staphylococcus  coagulase negative  ANTIBIOTIC_2    P        0.88          1        0.2    0.1000   0.3333
13  Staphylococcus         epidermidis  ANTIBIOTIC_2    P        0.11          1        0.5    0.1000   0.3333
14  Staphylococcus        haemolyticus  ANTIBIOTIC_2    P        0.32          1        0.5    0.1000   0.3333
15  Staphylococcus         lugdumensis  ANTIBIOTIC_2    P        0.45          1        0.5    0.1000   0.3333
16  Staphylococcus       saporphyticus  ANTIBIOTIC_2    P        0.18          1        0.2    0.1000   0.3333
17  Staphylococcus              aureus  ANTIBIOTIC_2    P        0.13          5        0.2    0.5000   0.3333
18    Enterococcus              durans  ANTIBIOTIC_2    N        0.64          1        0.2    0.2500   0.3333
19    Enterococcus             faecium  ANTIBIOTIC_2    N        0.48          1        0.2    0.2500   0.3333
20    Enterococcus         gallinarium  ANTIBIOTIC_2    N        0.10          1        0.5    0.2500   0.3333
21    Enterococcus            faecalis  ANTIBIOTIC_2    N        0.09          1        0.5    0.2500   0.3333
22   Streptococcus           viridians  ANTIBIOTIC_2    P        0.08          1        0.5    0.3333   0.3333
23   Streptococcus          pneumoniae  ANTIBIOTIC_2    P        0.89          2        0.5    0.6667   0.3333
Lets see the dataframe
71 dataframe
Lets use the ASAI object
 78 # -------------------------------
 79 # Create antimicrobial spectrum
 80 # -------------------------------
 81 # Create antimicrobial spectrum of activity instance
 82 asai = ASAI(column_genus='GENUS',
 83             column_specie='SPECIE',
 84             column_resistance='RESISTANCE',
 85             column_frequency='FREQUENCY',
 86             column_threshold='THRESHOLD',
 87             column_wgenus='W_GENUS',
 88             column_wspecie='W_SPECIE')
 89
 90 # Compute ASAI with uniform weights
 91 scores1 = asai.compute(dataframe,
 92     groupby=['ANTIBIOTIC', 'GRAM'],
 93     weights='uniform',
 94     threshold=None,
 95     min_freq=0).unstack()
 96
 97 # compute ASAI with frequency weights
 98 scores2 = asai.compute(dataframe,
 99     groupby=['ANTIBIOTIC', 'GRAM'],
100     weights='frequency',
101     threshold=None,
102     min_freq=0).unstack()
Lets see the ASAI with uniform weights
106 scores1
Lets see the ASAI with frequency weights
110 scores2
Lets display the information graphically
116 def plot_graph_asai(scores):
117     """Display ASAI as a horizontal bars
118     """
119     # Variables to plot.
120     x = scores.index.values
121     y_n = scores['ASAI_SCORE']['N'].values
122     y_p = scores['ASAI_SCORE']['P'].values
123
124     # Constants
125     colormap_p = scalar_colormap(y_p, cmap='Blues', vmin=-0.1, vmax=1.1)
126     colormap_n = scalar_colormap(y_n, cmap='Reds', vmin=-0.1, vmax=1.1)
127
128     # Create figure
129     f, ax = plt.subplots(1, 1, figsize=(8, 0.5))
130
131     # Plot
132     sns.barplot(x=y_p, y=x, palette=colormap_p, ax=ax, orient='h',
133                 saturation=0.5, label='Gram-positive')
134     sns.barplot(x=-y_n, y=x, palette=colormap_n, ax=ax, orient='h',
135                 saturation=0.5, label='Gram-negative')
136
137     # Configure
138     sns.despine(bottom=True)
139
140     # Configure
141     ax.set_xlim([-1, 1])
142     ax.legend(loc='center left')
143
144 # -----------------------------
145 # Plot
146 # -----------------------------
147 # Display bar graphs
148 plot_graph_asai(scores1)
149 plot_graph_asai(scores2)
150
151 # Display
152 plt.show()
Total running time of the script: ( 0 minutes 0.197 seconds)

