Note
Go to the end to download the full example code
Collateral Sensitivity Index (ACSI)
The Collateral Sensitivity Index - ACSI …
Warning
Pending…!
First, lets create the susceptibility test records dataset
14 # Libraries
15 import pandas as pd
16
17 from pyamr.datasets.load import fixture
18
19 # ----------------------------------
20 # Create data
21 # ----------------------------------
22 # Load the fixture_05.csv file.
23 susceptibility = fixture(name='fixture_06.csv')
24
25 # Format DataFrame
26 susceptibility.SENSITIVITY = \
27     susceptibility.SENSITIVITY.replace({
28         'resistant': 'R',
29         'intermediate': 'I',
30         'sensitive': 'S'
31 })
Lets see the susceptibility test records
35 susceptibility.head(10)
Lets compute the Antimicrobial Collateral Sensitivity Index or ACSI
42 # ------------------------------------------
43 # Compute the index
44 # ------------------------------------------
45 # Libraries
46 from pyamr.core.acsi import ACSI
47
48 # Compute index
49 contingency, combinations = \
50     ACSI().compute(susceptibility,
51         groupby=[
52             'DATE',
53             'SPECIMEN',
54             'MICROORGANISM'
55         ],
56         return_combinations=True)
57
58 # Show
59 print("\nCombinations:")
60 print(combinations)
61 print("\nContingency:")
62 print(contingency)
Combinations:
         DATE SPECIMEN MICROORGANISM LAB_NUMBER ANTIMICROBIAL_x ANTIMICROBIAL_y SENSITIVITY_x SENSITIVITY_y class
0  2021-01-01   BLDCUL          ECOL       lab1            AAUG            ACIP             S             S    SS
1  2021-01-01   BLDCUL          ECOL       lab2            AAUG            ACIP             S             R    SR
2  2021-01-01   BLDCUL          ECOL       lab3            AAUG            ACIP             S             R    SR
3  2021-01-01   BLDCUL          ECOL       lab4            AAUG            ACIP             R             R    RR
4  2021-01-02   BLDCUL          ECOL       lab5            AAUG            ACIP             S             S    SS
5  2021-01-02   BLDCUL          ECOL       lab6            AAUG            ACIP             S             R    SR
6  2021-01-02   BLDCUL          ECOL       lab7            AAUG            ACIP             R             R    RR
7  2021-01-03   BLDCUL          ECOL       lab8            AAUG            ACIP             S             I    SI
8  2021-01-03   BLDCUL          ECOL       lab9            AAUG            ACIP             R             R    RR
9  2021-01-03   BLDCUL          SAUR       lab9            ACIP            ACIP             R             R    RR
10 2021-01-04   URICUL          ECOL      lab10            AAUG            ACIP             R             S    RS
11 2021-01-04   URICUL          SAUR      lab10            AAUG            APEN             R             R    RR

Contingency:
class                                                               RR   RS   SI   SR   SS    acsi
DATE       SPECIMEN MICROORGANISM ANTIMICROBIAL_x ANTIMICROBIAL_y
2021-01-01 BLDCUL   ECOL          AAUG            ACIP             1.0  NaN  NaN  2.0  1.0  0.2027
2021-01-02 BLDCUL   ECOL          AAUG            ACIP             1.0  NaN  NaN  1.0  1.0  0.3662
2021-01-03 BLDCUL   ECOL          AAUG            ACIP             1.0  NaN  1.0  NaN  NaN  0.0000
                    SAUR          ACIP            ACIP             1.0  NaN  NaN  NaN  NaN  0.0000
2021-01-04 URICUL   ECOL          AAUG            ACIP             NaN  1.0  NaN  NaN  NaN  0.0000
                    SAUR          AAUG            APEN             1.0  NaN  NaN  NaN  NaN  0.0000
Lets see the contingency matrix
67 # Rename for docs display
68 rename = {
69     'MICROORGANISM': 'ORGANISM',
70     'ANTIMICROBIAL_x': 'ANTIBIOTIC_x',
71     'ANTIMICROBIAL_y': 'ANTIBIOTIC_y'
72 }
73
74 # Show
75 contingency \
76     .reset_index() \
77     .rename(columns=rename) \
78     .round(decimals=3)
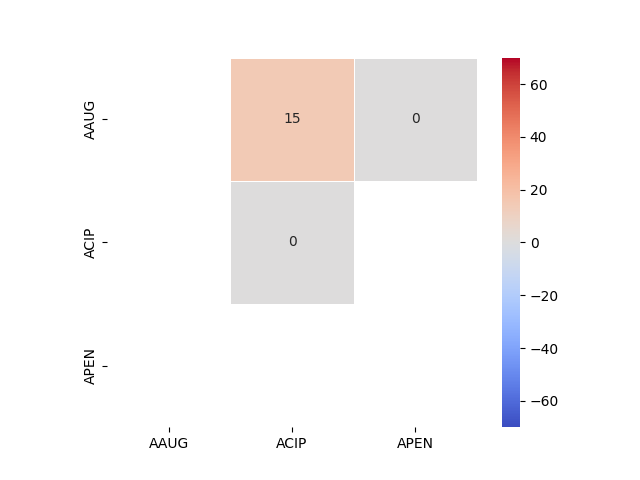
Lets compute and visualise the overall contingency matrix
 85 # Lets compute the overall index
 86 contingency = ACSI().compute(
 87     combinations.reset_index(),
 88     groupby=[],
 89     flag_combinations=True,
 90     return_combinations=False
 91 )
 92
 93 # Show
 94 print(contingency)
 95
 96 # Display
 97 import numpy as np
 98 import seaborn as sns
 99 import matplotlib.pyplot as plt
100
101 # Create index with all pairs
102 index = pd.MultiIndex.from_product(
103     [susceptibility.ANTIMICROBIAL.unique(),
104      susceptibility.ANTIMICROBIAL.unique()]
105 )
106
107 # Reformat
108 aux = contingency['acsi'] \
109     .reindex(index, fill_value=np.nan)\
110     .unstack()
111
112 # Display
113 sns.heatmap(data=aux * 100, annot=True, linewidth=.5,
114             cmap='coolwarm', vmin=-70, vmax=70, center=0,
115             square=True)
116
117 # Show
118 plt.show()

class                             RR   RS   SI   SR   SS    acsi
ANTIMICROBIAL_x ANTIMICROBIAL_y
AAUG            ACIP             3.0  1.0  1.0  3.0  2.0  0.1469
                APEN             1.0  NaN  NaN  NaN  NaN  0.0000
ACIP            ACIP             1.0  NaN  NaN  NaN  NaN  0.0000
Lets compute and visualise the temporal contingency matrix
123 # Lets compute the overall index
124 contingency = ACSI().compute(
125     combinations.reset_index(),
126     groupby=['DATE'],
127     flag_combinations=True,
128     return_combinations=False)
129
130 # Show
131 print(contingency)
132
133 # .. note:: Look for a nice visualisation of a matrix over time. In
134 #           addition to python libraries such as plotly, animations,
135 #           ... we can also check for js libraries such as Apache
136 #           echarts.
class                                        RR   RS   SI   SR   SS    acsi
DATE       ANTIMICROBIAL_x ANTIMICROBIAL_y
2021-01-01 AAUG            ACIP             1.0  NaN  NaN  2.0  1.0  0.2027
2021-01-02 AAUG            ACIP             1.0  NaN  NaN  1.0  1.0  0.3662
2021-01-03 AAUG            ACIP             1.0  NaN  1.0  NaN  NaN  0.0000
           ACIP            ACIP             1.0  NaN  NaN  NaN  NaN  0.0000
2021-01-04 AAUG            ACIP             NaN  1.0  NaN  NaN  NaN  0.0000
                           APEN             1.0  NaN  NaN  NaN  NaN  0.0000
Total running time of the script: ( 0 minutes 0.149 seconds)