Note
Go to the end to download the full example code
ACSI - Example using MIMIC
 7 # Libraries
 8 import sys
 9 import warnings
10 import numpy as np
11 import pandas as pd
12 import seaborn as sns
13 import matplotlib as mpl
14
15 from pathlib import Path
16
17 try:
18     __file__
19     TERMINAL = True
20 except:
21     TERMINAL = False
22
23
24 # Configure seaborn style (context=talk)
25 sns.set_theme(style="white")
26
27 # Configure warnings
28 warnings.filterwarnings("ignore",
29     category=pd.errors.DtypeWarning)
30
31 # -------------------------------------------------------
32 # Constants
33 # -------------------------------------------------------
34 # Rename columns for susceptibility
35 rename_susceptibility = {
36     'chartdate': 'DATE',
37     'micro_specimen_id': 'LAB_NUMBER',
38     'spec_type_desc': 'SPECIMEN',
39     'org_name': 'MICROORGANISM',
40     'ab_name': 'ANTIMICROBIAL',
41     'interpretation': 'SENSITIVITY'
42 }
Let’s load the susceptibility test data
48 # -----------------------------
49 # Load susceptibility test data
50 # -----------------------------
51 nrows=1000
52
53 # Helper
54 subset = rename_susceptibility.values()
55
56 # Load data
57 path = Path('../../pyamr/datasets/mimic')
58 data1 = pd.read_csv(path / 'susceptibility.csv', nrows=nrows)
59
60 # Rename columns
61 data1 = data1.rename(columns=rename_susceptibility)
62
63 # Format data
64 data1 = data1[subset]
65 data1 = data1.dropna(subset=subset, how='any')
66 data1.DATE = pd.to_datetime(data1.DATE)
69 data1.head(5)
Let’s compute the ACSI and return the combinations.
Note
This step is quite computationally expensive since it has to create all possible antimicrobial combinations within each isolate in the susceptibility test data. Thus, it is recommended to save the results for future analysis and/or visualisation.
 80 # Libraries
 81 from pyamr.core.acsi import ACSI
 82
 83 # Compute index
 84 contingency, combinations = \
 85     ACSI().compute(data1,
 86     groupby=[
 87         'DATE',
 88         'SPECIMEN',
 89         'MICROORGANISM'
 90     ],
 91     return_combinations=True)
 92
 93 # Save
 94 #contingency.to_csv('contingency_%s.csv' % nrows)
 95 #combinations.to_csv('combinations_%s.csv' % nrows)
 96
 97 # Display
 98 print("\nCombinations:")
 99 print(combinations)
100 print("\nContingency:")
101 print(contingency)
c:\users\kelda\desktop\repositories\github\pyamr\main\pyamr\core\acsi.py:120: RuntimeWarning:

invalid value encountered in divide

c:\users\kelda\desktop\repositories\github\pyamr\main\pyamr\core\acsi.py:121: RuntimeWarning:

invalid value encountered in divide


Combinations:
           DATE       SPECIMEN  MICROORGANISM  LAB_NUMBER ANTIMICROBIAL_x ANTIMICROBIAL_y SENSITIVITY_x SENSITIVITY_y class
0    2112-10-05  BLOOD CULTURE  VIRIDANS S...     3530668    CLINDAMYCIN    ERYTHROMYCIN              S             R    SR
1    2112-10-05  BLOOD CULTURE  VIRIDANS S...     3530668    CLINDAMYCIN    PENICILLIN G              S             S    SS
2    2112-10-05  BLOOD CULTURE  VIRIDANS S...     3530668    CLINDAMYCIN      VANCOMYCIN              S             S    SS
3    2112-10-05  BLOOD CULTURE  VIRIDANS S...     3530668   ERYTHROMYCIN    PENICILLIN G              R             S    RS
4    2112-10-05  BLOOD CULTURE  VIRIDANS S...     3530668   ERYTHROMYCIN      VANCOMYCIN              R             S    RS
...         ...            ...            ...         ...            ...             ...            ...           ...   ...
5074 2202-04-26          URINE  MORGANELLA...     8654517  NITROFURAN...      TOBRAMYCIN              R             R    RR
5075 2202-04-26          URINE  MORGANELLA...     8654517  NITROFURAN...   TRIMETHOPR...              R             R    RR
5076 2202-04-26          URINE  MORGANELLA...     8654517  PIPERACILL...      TOBRAMYCIN              S             R    SR
5077 2202-04-26          URINE  MORGANELLA...     8654517  PIPERACILL...   TRIMETHOPR...              S             R    SR
5078 2202-04-26          URINE  MORGANELLA...     8654517     TOBRAMYCIN   TRIMETHOPR...              R             R    RR

[5079 rows x 9 columns]

Contingency:
class                                                                  II  IR  IS  RI   RR   RS  SI   SR   SS  acsi
DATE       SPECIMEN      MICROORGANISM  ANTIMICROBI... ANTIMICROBI...
2112-10-05 BLOOD CULTURE VIRIDANS ST... CLINDAMYCIN    ERYTHROMYCIN   NaN NaN NaN NaN  NaN  NaN NaN  1.0  NaN   0.0
                                                       PENICILLIN G   NaN NaN NaN NaN  NaN  NaN NaN  NaN  1.0   0.0
                                                       VANCOMYCIN     NaN NaN NaN NaN  NaN  NaN NaN  NaN  1.0   0.0
                                        ERYTHROMYCIN   PENICILLIN G   NaN NaN NaN NaN  NaN  1.0 NaN  NaN  NaN   0.0
                                                       VANCOMYCIN     NaN NaN NaN NaN  NaN  1.0 NaN  NaN  NaN   0.0
...                                                                    ..  ..  ..  ..  ...  ...  ..  ...  ...   ...
2202-04-26 URINE         MORGANELLA ... NITROFURANTOIN TOBRAMYCIN     NaN NaN NaN NaN  1.0  NaN NaN  NaN  NaN   0.0
                                                       TRIMETHOPRI... NaN NaN NaN NaN  1.0  NaN NaN  NaN  NaN   0.0
                                        PIPERACILLI... TOBRAMYCIN     NaN NaN NaN NaN  NaN  NaN NaN  1.0  NaN   0.0
                                                       TRIMETHOPRI... NaN NaN NaN NaN  NaN  NaN NaN  1.0  NaN   0.0
                                        TOBRAMYCIN     TRIMETHOPRI... NaN NaN NaN NaN  1.0  NaN NaN  NaN  NaN   0.0

[4464 rows x 10 columns]
Let’s compute the ACSI.
Note
We are loading previously computed combinations.
112 # Libraries
113 from pyamr.datasets.load import fixture
114
115 # Path
116 combinations = fixture(name='mimic/asci/combinations.csv')
117
118 # Lets compute the overall index
119 contingency = ACSI().compute(
120     combinations.reset_index(),
121     groupby=[],
122     flag_combinations=True,
123     return_combinations=False
124 )
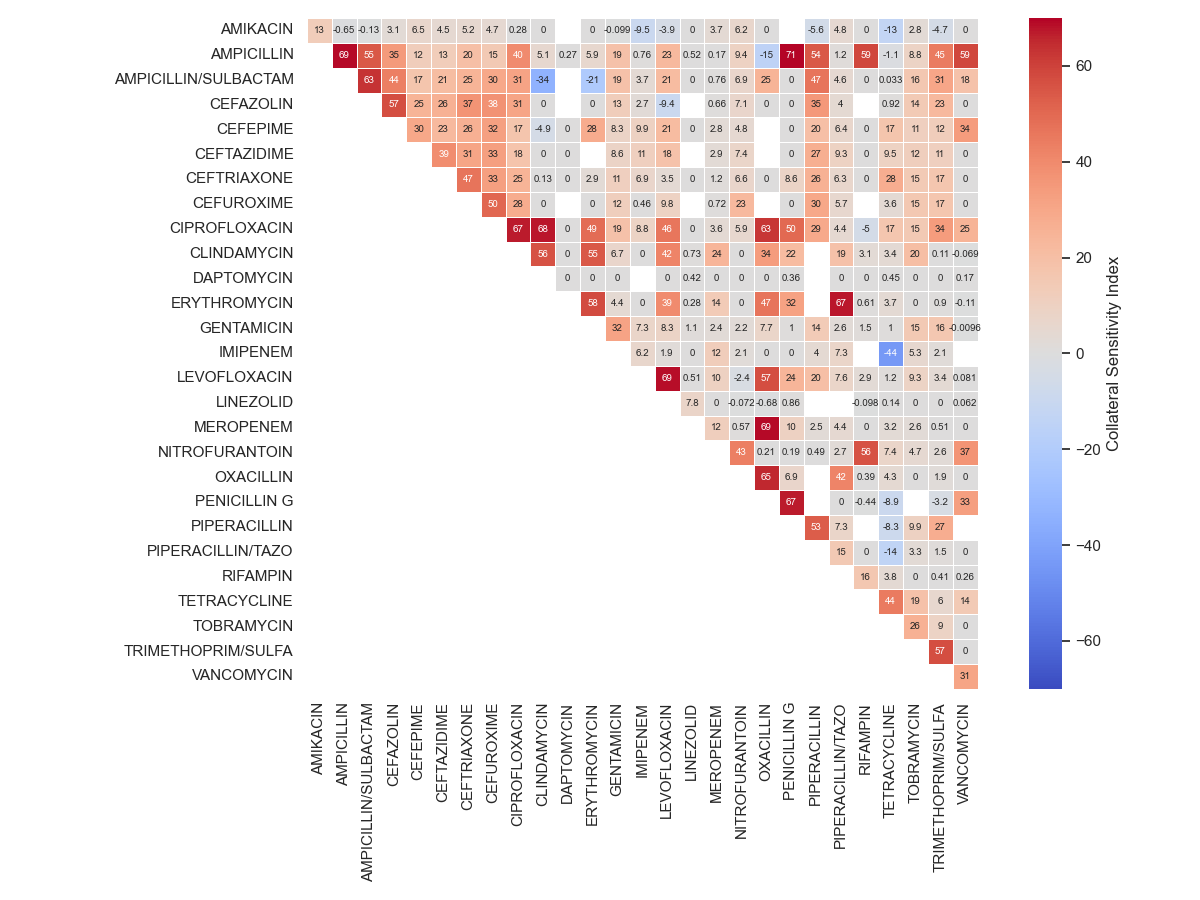
Let’s visualise the result
130 # ------------------------------------------
131 # Display
132 # ------------------------------------------
133 # Display
134 import numpy as np
135 import seaborn as sns
136 import matplotlib.pyplot as plt
137
138 # Get unique antimicrobials
139 s1 = set(combinations.ANTIMICROBIAL_x.unique())
140 s2 = set(combinations.ANTIMICROBIAL_x.unique())
141 abxs = s1.union(s2)
142
143 # Create index with all pairs
144 index = pd.MultiIndex.from_product([abxs, abxs])
145
146 # Reformat
147 aux = contingency['acsi'] \
148     .reindex(index, fill_value=np.nan) \
149     .unstack()
150
151 # Create figure
152 fig, axs = plt.subplots(nrows=1, ncols=1,
153      sharey=False, sharex=False, figsize=(12, 9)
154 )
155
156 # Display
157 sns.heatmap(data=aux * 100, ax=axs,
158     annot=True, annot_kws={'size':7}, square=True,
159     linewidth=.5, xticklabels=True, yticklabels=True,
160     cmap='coolwarm', vmin=-70, vmax=70, center=0,
161     cbar_kws={'label': 'Collateral Sensitivity Index'})
162
163 # Show
164 plt.tight_layout()
165 plt.show()

Total running time of the script: ( 0 minutes 7.821 seconds)