pyamr.core.sari
Functions
- pyamr.core.sari.sari(dataframe=None, strategy='hard', **kwargs)[source]
Computes the Single Antimicrobial Resistance Index.
- Parameters:
dataframe (pd.DataFrame) – A dataframe with the susceptibility test interpretations as columns. The default strategies used (see below) expect the following columns [‘sensitive’, ‘intermediate’, ‘resistant’] and if they do not appear they weill be set to zeros.
strategy (string or func, default=’hard’) – The method used to compute sari. The possible options are ‘soft’, ‘medium’ and ‘hard’. In addition, a function with the following signature func(dataframe, **kwargs) can be passed.
basicas R / R+Ssoftas R / R+I+Smediumas R+0.5I / R+0.5I+Shardas R+I / R+I+S
**kwargs (arguments to pass the strategy function.)
- Returns:
The resistance index
- Return type:
pd.Series
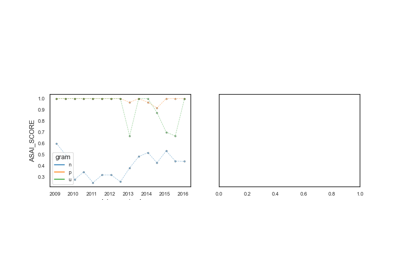
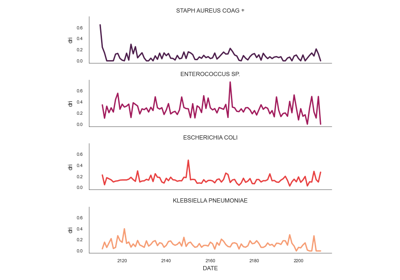
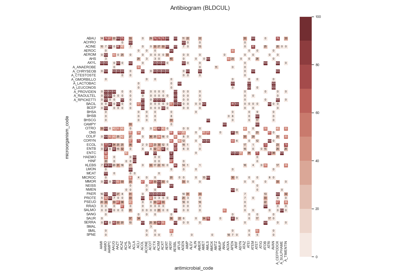
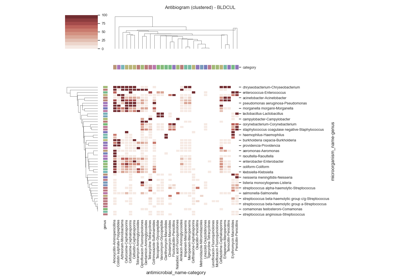
Examples using pyamr.core.sari.sari
Classes
- class pyamr.core.sari.SARI(groupby=['SPECIMEN', 'MICROORGANISM', 'ANTIMICROBIAL', 'SENSITIVITY'])[source]
Single Antimicrobial Resistance Index.
Methods:
compute(dataframe[, period, shift, cdate, ...])Computes Single Antimicrobial Resistance Index.
grouping(dataframe, period, cdate)Computes metric using independent groups.
rolling(dataframe, period, cdate[, shift])Computed metric using a rolling approach.
- compute(dataframe, period=None, shift=None, cdate=None, return_frequencies=True, **kwargs)[source]
Computes Single Antimicrobial Resistance Index.
Examples
shift
period
description
None
None
Uses all data (agnostic to time)
None
year
Value every year using whole year’s data.
None
2D
Value every 2 days using 2 days data.
2D
2D
Value every 2 days using 2 days data.
None
2
Invalid2D
2
InvalidValue every 2 days using 2x2D=4 days data.2D
None
Invalid- period cannot be None (in this case)2D
year
Invalid- period cannot be a year (in this case)year
–
Invalid- shift cannot be a named time.2
–
Invalid- shift cannot be a number.Note
Using shift=2D and period=2D is equivalent to shift=2D and period=1.
- Parameters:
dataframe (pd.DataFrame) – A dataframe with the susceptibility test interpretations as columns. The default strategies used (see below) expect the following columns [‘sensitive’, ‘intermediate’, ‘resistant’] and if they do not appear they weill be set to zeros.
shift (str) – Frequency (datetime) value to group by when applying a rolling window.
period (str, int) – If used alone (shift=None) is the value used to create groups (e.g. year). The whole data within the groups will be used to compute the metrics. On the contrary, when used in combinations with shift, it indicates the interval used to compute the metrics (e.g. 2D, 2 times the shift value)
cdate (string, default=None) – The column that will be used as date.
return_frequencies (boolean, default=True) – Whether to return the frequencies or just the resistance index.
strategy (string or func, default=’hard’) – The method used to compute sari. The possible options are ‘soft’, ‘medium’ and ‘hard’. In addition, a function with the following signature func(DataFrame, **kwargs) can be passed.
basicas R / R+Ssoftas R / R+I+Smediumas R+0.5I / R+0.5I+Shardas R+I / R+I+S
**kwargs (arguments to pass the strategy function.)
- Returns:
The resistance index (pd.Series) or a pd.DataFrame with the resistance index (sari) and the frequencies.
- Return type:
pd.Series or pd.DataFrame
