Note
Go to the end to download the full example code
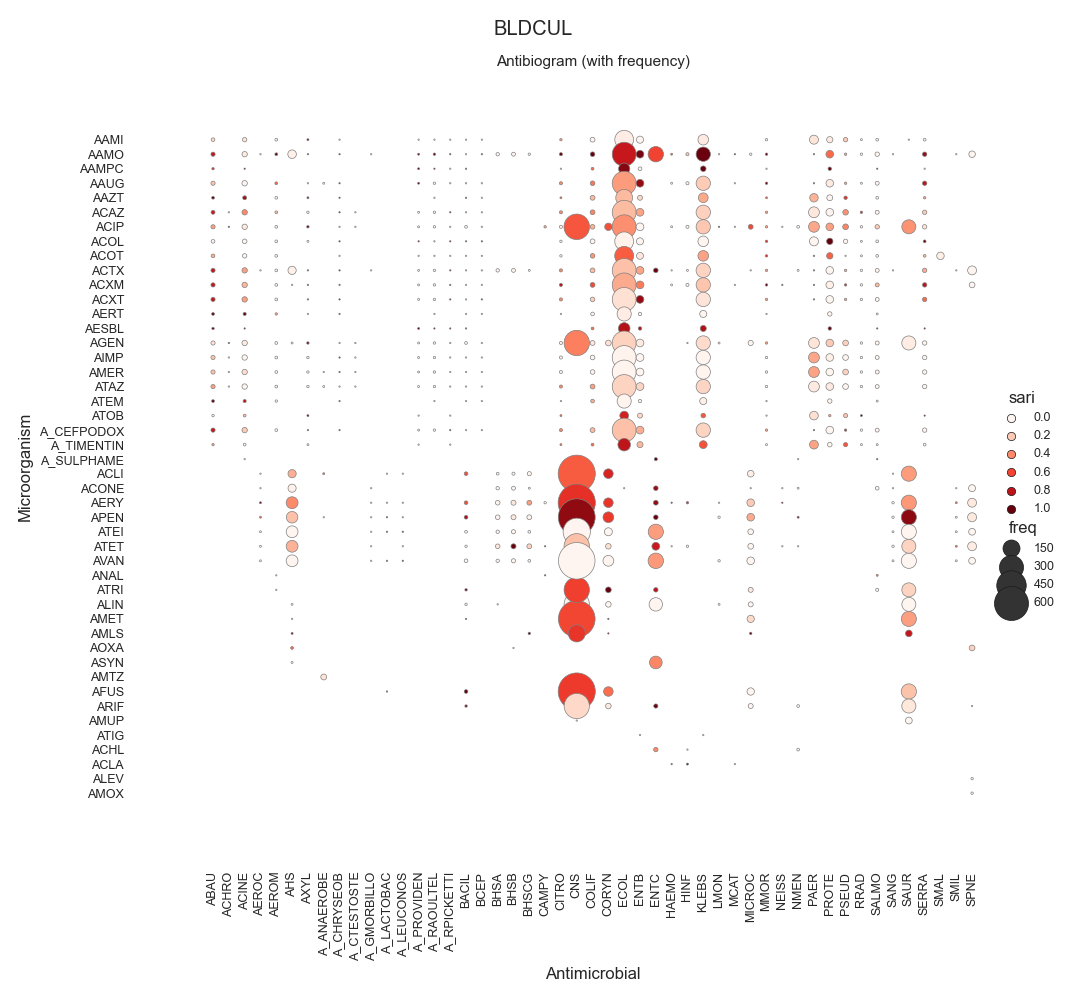
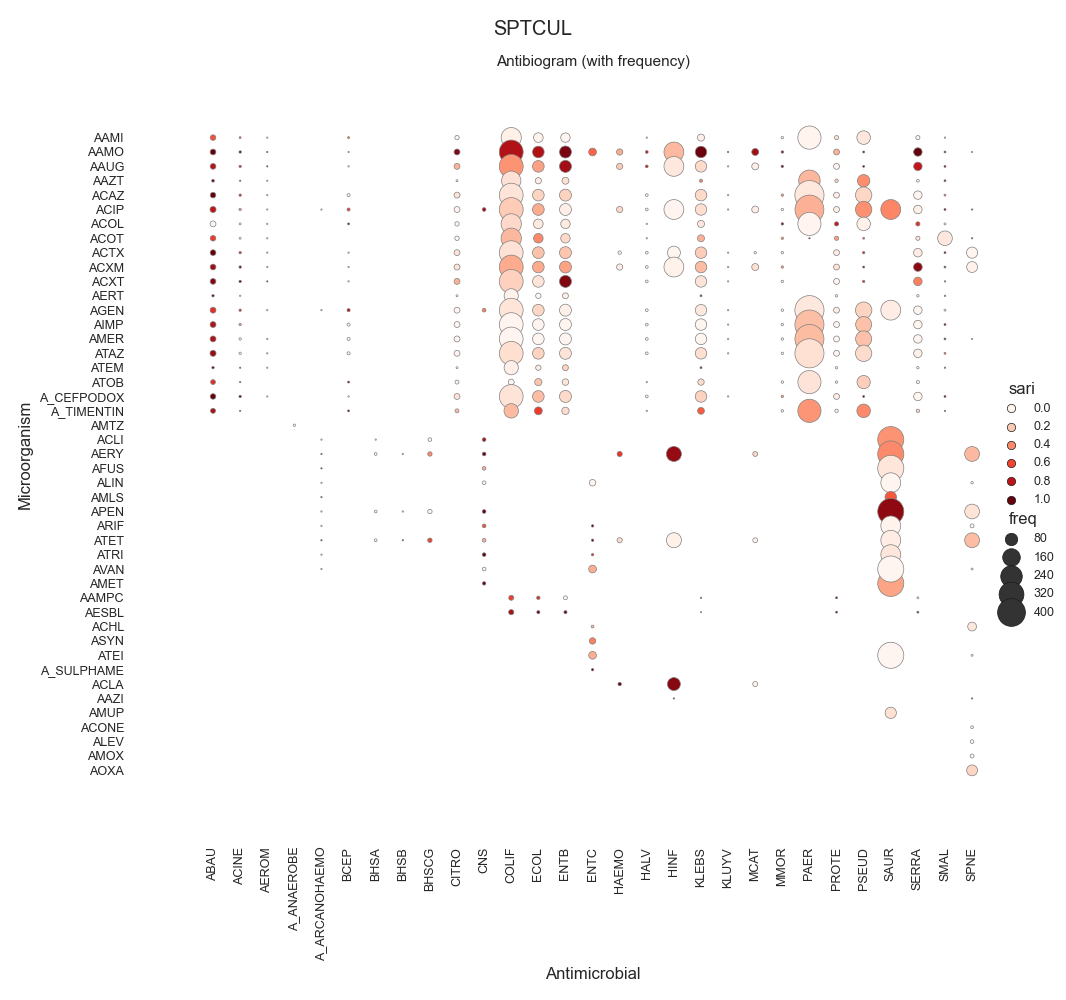
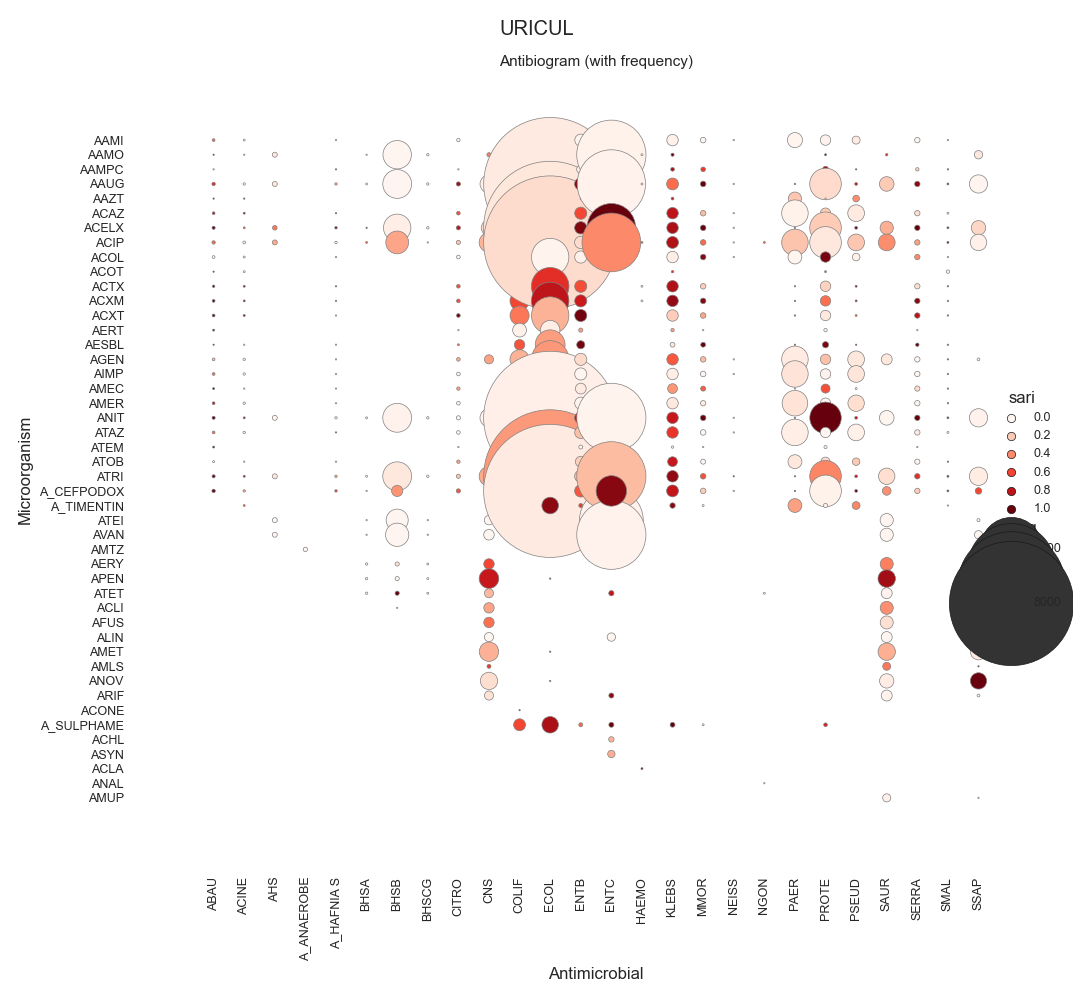
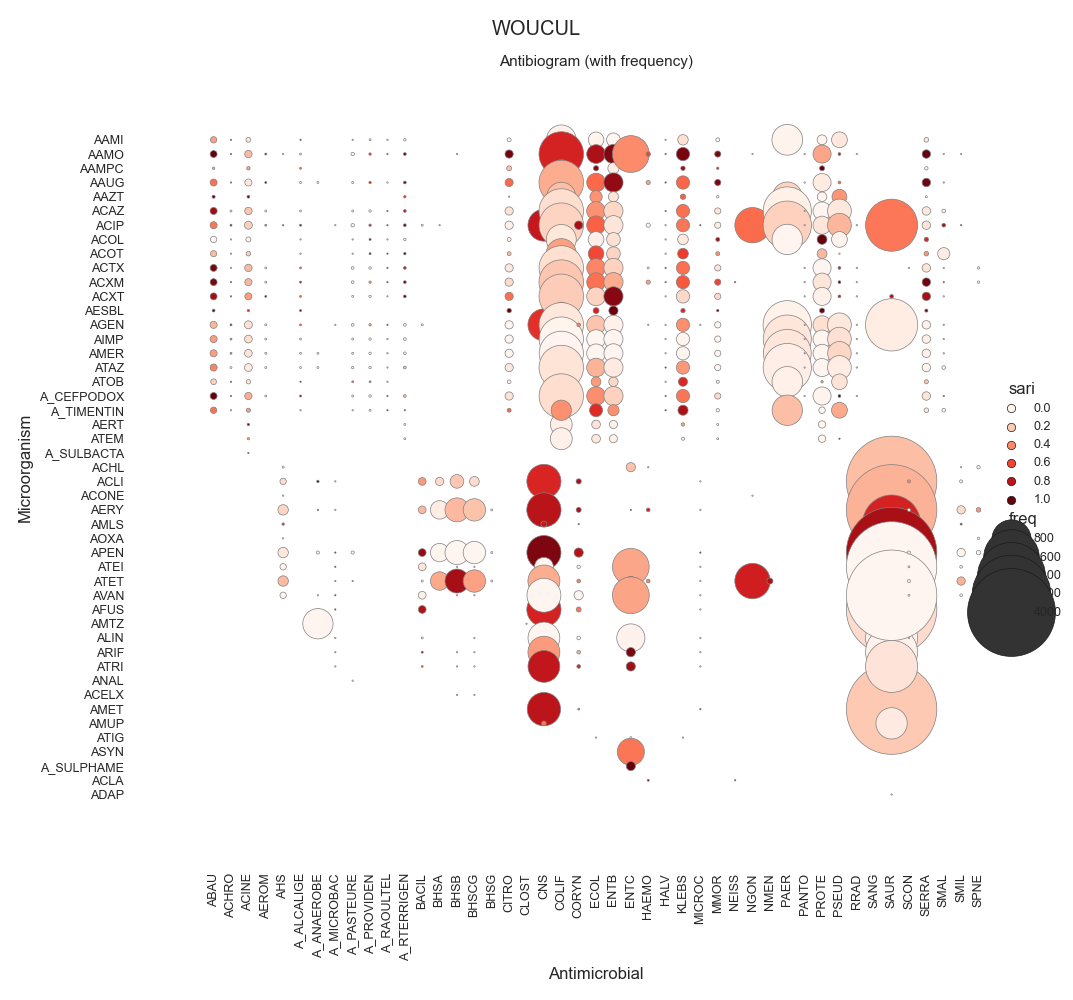
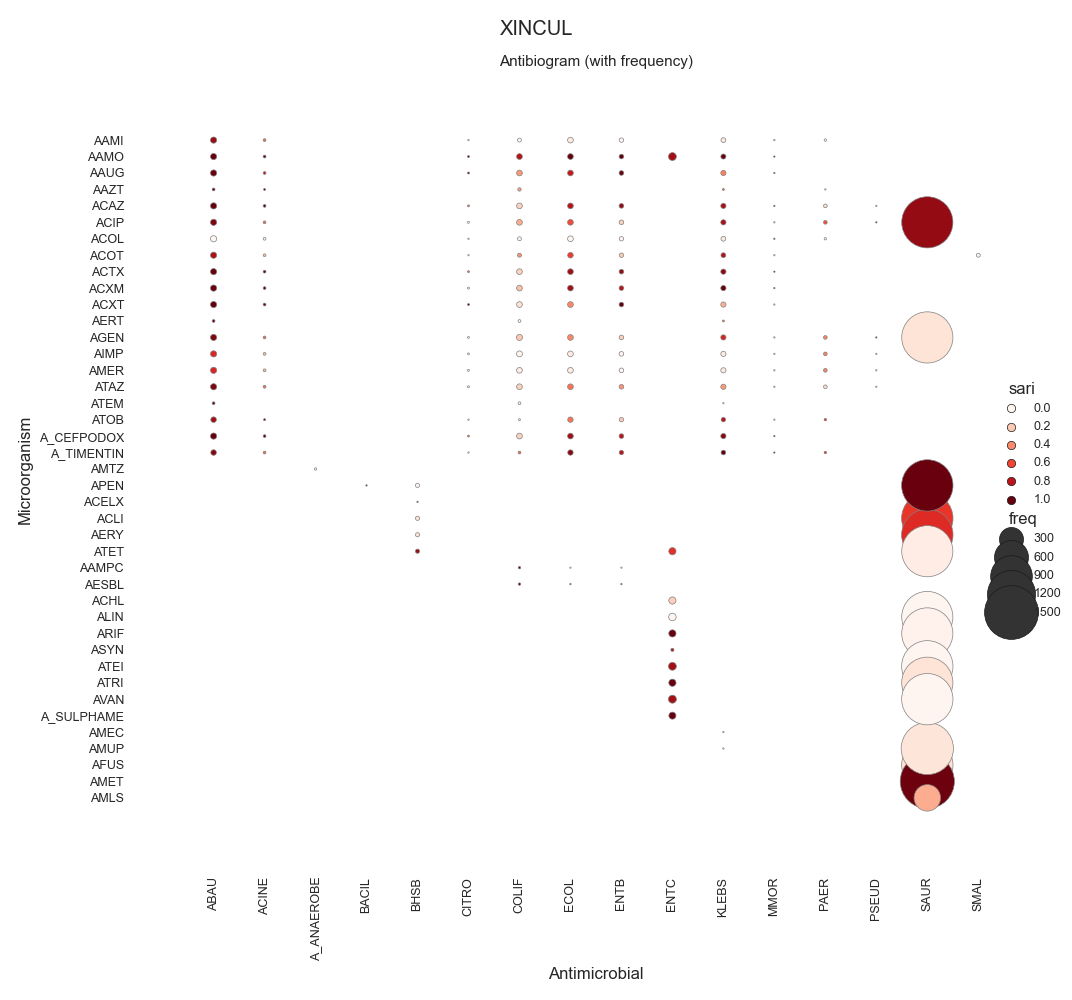
SARI - By specimen w/ sns.relmap
Todo
Explain…
Data:
       date_received  date_outcome  patient_id laboratory_number specimen_code  specimen_name specimen_description  ... microorganism_name antimicrobial_code antimicrobial_name sensitivity_method  sensitivity mic  reported
0         2009-01-03           NaN       20091           X428501        BLDCUL            NaN                blood  ...         klebsiella               AAMI           amikacin                NaN    sensitive NaN       NaN
1         2009-01-03           NaN       20091           X428501        BLDCUL            NaN                blood  ...         klebsiella               AAMO        amoxycillin                NaN    resistant NaN       NaN
2         2009-01-03           NaN       20091           X428501        BLDCUL            NaN                blood  ...         klebsiella               AAUG          augmentin                NaN    sensitive NaN       NaN
3         2009-01-03           NaN       20091           X428501        BLDCUL            NaN                blood  ...         klebsiella               AAZT          aztreonam                NaN    sensitive NaN       NaN
4         2009-01-03           NaN       20091           X428501        BLDCUL            NaN                blood  ...         klebsiella               ACAZ        ceftazidime                NaN    sensitive NaN       NaN
...              ...           ...         ...               ...           ...            ...                  ...  ...                ...                ...                ...                ...          ...  ..       ...
319117    2009-12-31           NaN       24645          H2012337        BLDCUL            NaN                blood  ...       enterococcus               AAMO        amoxycillin                NaN    sensitive NaN       NaN
319118    2009-12-31           NaN       24645          H2012337        BLDCUL            NaN                blood  ...       enterococcus               ALIN          linezolid                NaN    sensitive NaN       NaN
319119    2009-12-31           NaN       24645          H2012337        BLDCUL            NaN                blood  ...       enterococcus               ASYN           synercid                NaN    resistant NaN       NaN
319120    2009-12-31           NaN       24645          H2012337        BLDCUL            NaN                blood  ...       enterococcus               ATEI        teicoplanin                NaN    sensitive NaN       NaN
319121    2009-12-31           NaN       24645          H2012337        BLDCUL            NaN                blood  ...       enterococcus               AVAN         vancomycin                NaN    sensitive NaN       NaN

[319122 rows x 15 columns]

Columns:
Index(['date_received', 'date_outcome', 'patient_id', 'laboratory_number', 'specimen_code', 'specimen_name', 'specimen_description', 'microorganism_code', 'microorganism_name', 'antimicrobial_code', 'antimicrobial_name', 'sensitivity_method', 'sensitivity', 'mic', 'reported'], dtype='object')
SARI (overall):
                                                     intermediate  resistant  sensitive    freq    sari
specimen_code microorganism_code antimicrobial_code
BFLCUL        AHS                ACHL                         0.0        0.0        1.0     1.0  0.0000
                                 ACLI                         0.0        0.0        2.0     2.0  0.0000
                                 ACTX                         0.0        0.0        1.0     1.0  0.0000
                                 AERY                         0.0        1.0        1.0     2.0  0.5000
                                 APEN                         0.0        0.0        2.0     2.0  0.0000
...                                                           ...        ...        ...     ...     ...
XINCUL        SAUR               ATEI                         0.0        0.0     1365.0  1365.0  0.0000
                                 ATET                         0.0       67.0     1288.0  1355.0  0.0494
                                 ATRI                         0.0      145.0     1213.0  1358.0  0.1068
                                 AVAN                         0.0        0.0     1364.0  1364.0  0.0000
              SMAL               ACOT                         0.0        0.0        8.0     8.0  0.0000

[4491 rows x 5 columns]
Cultures:
specimen_code
URICUL    116627.0
WOUCUL     94918.0
XINCUL     21427.0
SPTCUL     21113.0
BLDCUL     20333.0
ENTCUL     13110.0
T&FCUL      8150.0
MRSCUL      7865.0
VAGCUL      7425.0
EYECUL      2839.0
GUMCUL      1634.0
FAECUL      1317.0
URECUL       802.0
TISCUL       474.0
BFLCUL       450.0
SEMCUL       290.0
NEOCUL       213.0
PDFCUL        68.0
CSFCUL        32.0
RGNS          20.0
FUNSTC        14.0
TBCUL          1.0
Name: freq, dtype: float64
C:\Users\kelda\Desktop\repositories\github\pyAMR\main\examples\indexes\plot_sari_c_relmap.py:154: MatplotlibDeprecationWarning:

The legendHandles attribute was deprecated in Matplotlib 3.7 and will be removed two minor releases later. Use legend_handles instead.

C:\Users\kelda\Desktop\repositories\github\pyAMR\main\examples\indexes\plot_sari_c_relmap.py:154: MatplotlibDeprecationWarning:

The legendHandles attribute was deprecated in Matplotlib 3.7 and will be removed two minor releases later. Use legend_handles instead.

C:\Users\kelda\Desktop\repositories\github\pyAMR\main\examples\indexes\plot_sari_c_relmap.py:154: MatplotlibDeprecationWarning:

The legendHandles attribute was deprecated in Matplotlib 3.7 and will be removed two minor releases later. Use legend_handles instead.

C:\Users\kelda\Desktop\repositories\github\pyAMR\main\examples\indexes\plot_sari_c_relmap.py:154: MatplotlibDeprecationWarning:

The legendHandles attribute was deprecated in Matplotlib 3.7 and will be removed two minor releases later. Use legend_handles instead.

C:\Users\kelda\Desktop\repositories\github\pyAMR\main\examples\indexes\plot_sari_c_relmap.py:154: MatplotlibDeprecationWarning:

The legendHandles attribute was deprecated in Matplotlib 3.7 and will be removed two minor releases later. Use legend_handles instead.
  9 # Libraries
 10 import sys
 11 import numpy as np
 12 import pandas as pd
 13 import seaborn as sns
 14 import matplotlib as mpl
 15 import matplotlib.pyplot as plt
 16
 17 # Import own libraries
 18 from pyamr.core.sari import SARI
 19 from pyamr.core.freq import Frequency
 20 from pyamr.datasets.load import make_susceptibility
 21
 22 # -------------------------
 23 # Configuration
 24 # -------------------------
 25 # Configure seaborn style (context=talk)
 26 sns.set(style="white")
 27
 28 # Set matplotlib
 29 mpl.rcParams['xtick.labelsize'] = 9
 30 mpl.rcParams['ytick.labelsize'] = 9
 31 mpl.rcParams['axes.titlesize'] = 11
 32 mpl.rcParams['legend.fontsize'] = 9
 33
 34 # Pandas configuration
 35 pd.set_option('display.max_colwidth', 40)
 36 pd.set_option('display.width', 300)
 37 pd.set_option('display.precision', 4)
 38
 39 # Numpy configuration
 40 np.set_printoptions(precision=2)
 41
 42 # -------------------------------------------
 43 # Methods
 44 # -------------------------------------------
 45 def create_mapper(dataframe, column_key, column_value):
 46     """This method constructs a mapper
 47
 48     Parameters
 49     ----------
 50     dataframe: dataframe-like
 51       The dataframe from which the columns are extracted
 52
 53     column_key: string-like
 54       The name of the column with the values for the keys of the mapper
 55
 56     column_value: string-like
 57       The name of the column with the values for the values of the mapper
 58
 59     Returns
 60     -------
 61     dictionary
 62     """
 63     dataframe = dataframe[[column_key, column_value]]
 64     dataframe = dataframe.drop_duplicates()
 65     return dict(zip(dataframe[column_key], dataframe[column_value]))
 66
 67
 68 # -------------------------------------------
 69 # Load data
 70 # -------------------------------------------
 71 # Load data
 72 data = make_susceptibility()
 73
 74 # Show
 75 print("\nData:")
 76 print(data)
 77 print("\nColumns:")
 78 print(data.columns)
 79
 80 # -------------------------------------------
 81 # Compute SARI
 82 # -------------------------------------------
 83 # Libraries
 84 from pyamr.core.sari import SARI
 85
 86 # Create sari instance
 87 sari = SARI(groupby=['specimen_code',
 88                      'microorganism_code',
 89                      'antimicrobial_code',
 90                      'sensitivity'])
 91
 92 # Compute SARI overall
 93 sari_overall = sari.compute(data,
 94     return_frequencies=True)
 95
 96 # Show
 97 print("SARI (overall):")
 98 print(sari_overall)
 99
100
101 # -------------------------------------------
102 # Plot
103 # -------------------------------------------
104 # Reset
105 sari_overall = sari_overall.reset_index()
106
107 # Count records per specimen
108 specimen_count = sari_overall \
109     .groupby('specimen_code').freq.sum() \
110     .sort_values(ascending=False)
111
112 # Show
113 print("Cultures:")
114 print(specimen_count)
115
116 # Filter
117 sari_overall = sari_overall[sari_overall \
118     .specimen_code.isin( \
119         specimen_count.index.values[:5])]
120
121 # Loop
122 for specimen, df in sari_overall.groupby(by='specimen_code'):
123
124     # ------------
125     # Plot Heatmap
126     # ------------
127     # Create colormap
128     cmap = sns.color_palette("Reds", desat=0.5, n_colors=10)
129
130     # Configura
131     sizes = (df.freq.min(), df.freq.max())
132
133     # Plot
134     g = sns.relplot(data=df.reset_index(), x='microorganism_code',
135                     y='antimicrobial_code', hue="sari", size="freq",
136                     palette='Reds', hue_norm=(0, 1), edgecolor="gray",
137                     linewidth=0.5, sizes=sizes,  # size_norm=sizes,
138                     dashes=True, legend='brief', height=10)
139
140     # Configure plot
141     g.set(xlabel="Antimicrobial",
142           ylabel="Microorganism",
143           title='Antibiogram (with frequency)',
144           #aspect='equal'
145     )
146     g.despine(left=True, bottom=True)
147     g.ax.margins(.1)
148
149     # Configure xticks
150     for label in g.ax.get_xticklabels():
151         label.set_rotation(90)
152
153     # Configure legend
154     for artist in g.legend.legendHandles:
155         artist.set_edgecolor("k")
156         artist.set_linewidth(0.5)
157
158     # Superior title
159     plt.suptitle(specimen)
160
161     # Add grid lines.
162     # plt.grid(linestyle='-', linewidth=0.5, color='.7')
163
164     # Adjust
165     plt.tight_layout()
166
167 # Show
168 plt.show()
Total running time of the script: ( 0 minutes 5.216 seconds)
