Note
Click here to download the full example code
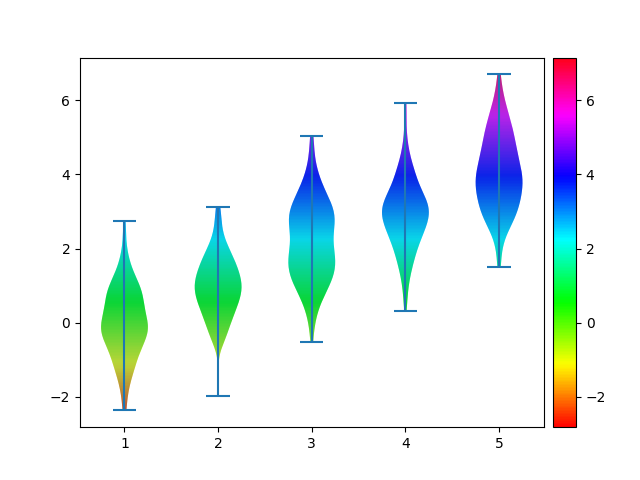
10. Violin plot with linear colormap
This script demonstrates a clever technique for creating a violin plot where the fill color is a continuous, linear colormap mapped to the y-axis values. 🎻
Instead of using a simple solid fill, it uses the paths of the
violin bodies as clipping masks. An imshow gradient is then
displayed underneath, making it visible only within the violin
shapes. A corresponding colorbar is added to complete the
visualization.
Out:
C:\Users\kelda\Desktop\repositories\github\python-spare-code\main\examples\matplotlib\plot_main10_violin_cmap.py:52: MatplotlibDeprecationWarning:

The get_cmap function was deprecated in Matplotlib 3.7 and will be removed in 3.11. Use ``matplotlib.colormaps[name]`` or ``matplotlib.colormaps.get_cmap()`` or ``pyplot.get_cmap()`` instead.

C:\Users\kelda\Desktop\repositories\github\python-spare-code\main\examples\matplotlib\plot_main10_violin_cmap.py:56: UserWarning:

FigureCanvasAgg is non-interactive, and thus cannot be shown
17 # ``mpl.violin``
18
19 import matplotlib
20 import numpy as np
21 import matplotlib.pyplot as plt
22 from matplotlib.path import Path
23 from matplotlib.patches import PathPatch
24 from mpl_toolkits.axes_grid1.axes_divider import make_axes_locatable
25
26
27 x = [np.random.normal(loc=i, scale=1, size=(100,)) for i in range(5)]
28
29 fig, ax = plt.subplots()
30 violins = ax.violinplot(x)
31
32 ymin, ymax = ax.get_ylim()
33 xmin, xmax = ax.get_xlim()
34
35 # create a numpy image to use as a gradient
36 Nx,Ny=1,1000
37 imgArr = np.tile(np.linspace(0,1,Ny), (Nx,1)).T
38 cmap = 'hsv'
39
40 for violin in violins['bodies']:
41     path = Path(violin.get_paths()[0].vertices)
42     patch = PathPatch(path, facecolor='none', edgecolor='none')
43     ax.add_patch(patch)
44     img = ax.imshow(imgArr, origin="lower", extent=[xmin,xmax,ymin,ymax], aspect="auto",
45                     cmap=cmap,
46                     clip_path=patch)
47
48 # colorbar
49 ax_divider = make_axes_locatable(ax)
50 cax = ax_divider.append_axes("right", size="5%", pad="2%")
51 norm = matplotlib.colors.Normalize(vmin=ymin, vmax=ymax)
52 cb = matplotlib.colorbar.ColorbarBase(cax, cmap=matplotlib.cm.get_cmap(cmap),
53                                 norm=norm,
54                                 orientation='vertical')
55
56 plt.show()
Total running time of the script: ( 0 minutes 0.246 seconds)