Note
Click here to download the full example code
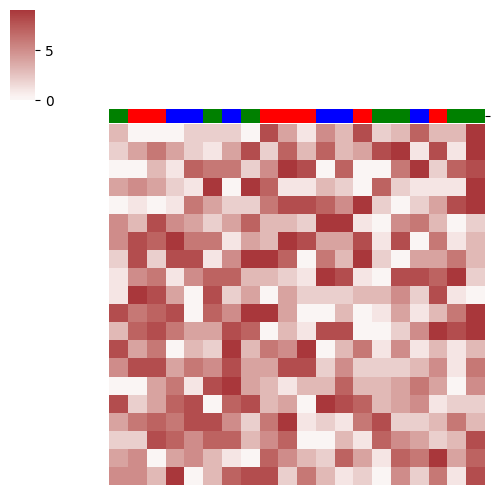
05.a sns.clustermap basic sample
This script shows how to use seaborn.clustermap to plot a
heatmap with a colored bar annotating the columns. While
clustermap is designed for hierarchical clustering, this
example deactivates that feature to maintain the original data
order. Its main purpose is to demonstrate how to visually group
columns by passing a color mapping to the col_colors parameter.
Note
The hierarchical clustering has been deactivated.

Out:
     A0  A1  A2  A3  A4  A5  A6  A7  A8  A9  A10  A11  A12  A13  A14  A15  A16  A17  A18  A19
A0    1   1   0   8   1   8   0   9   3   2    3    2    9    3    5    7    2    5    5    6
A1    7   4   6   9   4   9   2   7   8   9    7    6    3    0    3    5    1    8    6    3
A2    8   1   3   5   2   9   6   4   2   9    2    4    4    0    9    4    0    1    7    6
A3    5   7   4   1   1   2   9   3   8   5    1    3    0    3    3    1    7    2    2    3
A4    1   8   4   7   9   6   5   9   4   2    4    9    3    4    3    5    5    6    0    0
A5    0   2   1   6   7   7   0   9   4   6    2    0    0    7    4    0    4    1    9    2
A6    2   5   5   6   6   8   1   8   6   9    0    2    3    5    7    8    9    9    6    4
A7    9   3   9   8   0   2   7   4   9   3    7    0    9    3    7    2    5    8    4    8
A8    3   9   9   1   8   6   7   0   2   9    8    7    2    0    2    3    9    9    7    2
A9    5   1   3   5   4   1   9   2   8   5    9    5    3    3    8    0    8    3    9    7
A10   8   0   7   9   9   2   2   6   9   9    1    5    3    2    9    2    4    7    5    4
A11   0   8   8   6   6   3   8   5   5   2    1    4    8    6    5    5    7    9    6    7
A12   7   6   0   7   9   1   3   9   7   0    3    7    1    7    9    8    2    4    8    6
A13   0   7   0   8   2   4   4   2   3   0    7    9    2    7    6    7    5    8    3    3
A14   5   1   6   6   9   1   9   3   5   8    4    4    5    5    5    4    3    5    7    4
A15   8   2   1   3   7   0   0   8   8   9    6    0    5    9    2    5    6    9    8    4
A16   9   3   0   6   9   3   6   3   7   4    1    3    9    5    1    9    5    4    3    1
A17   5   0   5   0   5   3   1   7   7   4    9    7    8    3    1    6    0    8    2    0
A18   9   2   8   1   9   8   5   3   2   9    5    9    6    6    1    3    4    0    9    9
A19   2   6   9   9   5   6   8   2   2   8    1    8    7    8    2    6    4    0    6    9
['b', 'g', 'b', 'r', 'g', 'g', 'b', 'r', 'r', 'b', 'b', 'b', 'g', 'r', 'g', 'g', 'g', 'g', 'r', 'r']
A0     Group b
A1     Group g
A2     Group b
A3     Group r
A4     Group g
A5     Group g
A6     Group b
A7     Group r
A8     Group r
A9     Group b
A10    Group b
A11    Group b
A12    Group g
A13    Group r
A14    Group g
A15    Group g
A16    Group g
A17    Group g
A18    Group r
A19    Group r
dtype: object
C:\Users\kelda\Desktop\repositories\github\python-spare-code\main\examples\matplotlib\plot_main05_a_clustermap.py:88: UserWarning:

FigureCanvasAgg is non-interactive, and thus cannot be shown
16 """
17 # Display 0
18 iris = sns.load_dataset("iris")
19 species = iris.pop("species")
20 lut = dict(zip(species.unique(), "rbg"))
21 row_colors = species.map(lut)
22 """
23
24 # Libraries
25 import numpy as np
26 import pandas as pd
27 import seaborn as sns
28 import matplotlib.pyplot as plt
29
30 # Constants
31 N = 20
32 C = sns.color_palette("Spectral", n_colors=5, as_cmap=False)
33
34 # Create data
35 data = np.random.randint(low=0, high=10, size=(N, N))
36 colors = [np.random.choice(['r', 'g', 'b']) for i in range(N)]
37 series = pd.Series({'A%s'%i:'Group %s'%c for i,c in enumerate(colors)})
38
39 # Create DataFrame
40 df = pd.DataFrame(data,
41     index=['A%s'%i for i in range(N)],
42     columns=['A%s'%i for i in range(N)]
43 )
44
45 # Show
46 print(df)
47 print(colors)
48 print(series)
49
50 # Display 1
51 # ---------
52 # Create colors dictionary
53 col_colors = dict(zip(df.columns, colors))
54
55 # Show
56 g = sns.clustermap(df,
57     figsize=(5,5),
58     row_cluster=False, col_cluster=False,
59     #row_colors=col_colors,
60     col_colors=pd.Series(col_colors),
61     linewidths=0,
62     xticklabels=False, yticklabels=False,
63     center=0, cmap="vlag"
64 )
65
66 # Display 2
67 # ---------
68 # Create colors dictionary
69
70 col_colors = series.map({
71     'Group g': 'g',
72     'Group b': 'b',
73     'Group r': 'r'
74 })
75
76 # Show
77 g = sns.clustermap(df,
78     figsize=(5,5),
79     row_cluster=False, col_cluster=False,
80     #row_colors=col_colors,
81     col_colors=pd.Series(col_colors),
82     linewidths=0,
83     xticklabels=False, yticklabels=False,
84     center=0, cmap="vlag"
85 )
86
87 # Show
88 plt.show()
Total running time of the script: ( 0 minutes 0.298 seconds)