Note
Click here to download the full example code
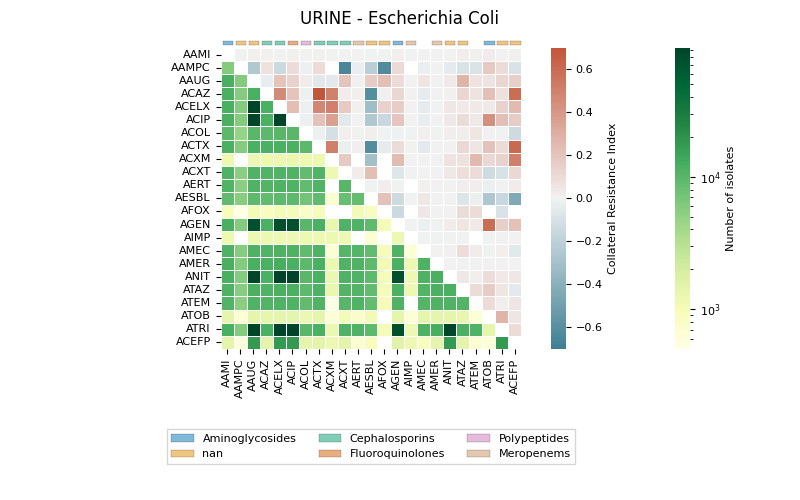
06.b sns.heatmap for CRI v2
Plot rectangular data as a color-encoded matrix.
The generates a heatmap visualization for a dataset related to collateral sensitivity. It uses the Seaborn library to plot the rectangular data as a color-encoded matrix. The code loads the data from a CSV file, creates mappings for categories and colors, and then plots the heatmap using the loaded data and color maps. It also includes annotations, colorbar axes, category patches, legend elements, and formatting options to enhance the visualization.
16 # Libraries
17 import numpy as np
18 import pandas as pd
19 import seaborn as sns
20 import matplotlib as mpl
21 import matplotlib.pyplot as plt
22
23 from pathlib import Path
24 from matplotlib.patches import Patch
25 from matplotlib.colors import LogNorm
26 from matplotlib.patches import Rectangle
27
28 # See https://matplotlib.org/devdocs/users/explain/customizing.html
29 mpl.rcParams['axes.titlesize'] = 8
30 mpl.rcParams['axes.labelsize'] = 8
31 mpl.rcParams['xtick.labelsize'] = 8
32 mpl.rcParams['ytick.labelsize'] = 8
33
34 try:
35     __file__
36     TERMINAL = True
37 except:
38     TERMINAL = False
Lets load the data and create color mapping variables
43 # Load data
44 path = Path('../../datasets/collateral-sensitivity/sample')
45 data = pd.read_csv(path / 'matrix.csv', index_col=0)
46 abxs = pd.read_csv(path / 'categories.csv', index_col=0)
47
48 # Create dictionary to map category to color
49 labels = abxs.category
50 palette = sns.color_palette('colorblind', labels.nunique())
51 lookup = dict(zip(labels.unique(), palette))
52
53 # Create dictionary to map code to category
54 code2cat = dict(zip(abxs.antimicrobial_code, abxs.category))
55
56 # Create colors
57 colors = data.columns.to_series().map(code2cat).map(lookup)
Lets see the data
62 if TERMINAL:
63     print("\nData:")
64     print(data)
65 data.iloc[:7,:7]
Lets see the antimicrobials
69 if TERMINAL:
70     print("\nAntimicrobials:")
71     print(abxs)
72 abxs
Lets create some variables.
78 # Create color maps
79 cmapu = sns.color_palette("YlGn", as_cmap=True)
80 cmapl = sns.diverging_palette(220, 20, as_cmap=True)
81
82 # Create triangular matrices
83 masku = np.triu(np.ones_like(data))
84 maskl = np.tril(np.ones_like(data))
Let’s display a heatmap
 91 # Draw (heatmap)
 92 fig, axs = plt.subplots(nrows=1, ncols=1,
 93     sharey=False, sharex=False, figsize=(8, 5)
 94 )
 95
 96 # Display
 97 r1 = sns.heatmap(data=data, cmap=cmapu, mask=masku, ax=axs,
 98             annot=False, linewidth=0.5, norm=LogNorm(),
 99             annot_kws={"size": 8}, square=True, vmin=0,
100             cbar_kws={'label': 'Number of isolates'})
101
102 r2 = sns.heatmap(data=data, cmap=cmapl, mask=maskl, ax=axs,
103             annot=False, linewidth=0.5, vmin=-0.7, vmax=0.7,
104             center=0, annot_kws={"size": 8}, square=True,
105             xticklabels=True, yticklabels=True,
106             cbar_kws={'label': 'Collateral Resistance Index'})
107
108 # Create patches for categories
109 category_patches = []
110 for i in axs.get_xticklabels():
111     try:
112         x, y = i.get_position()
113         c = colors.to_dict().get(i.get_text(), 'k')
114         #i.set_color(c) # for testing
115
116         # Add patch.
117         category_patches.append(
118             Rectangle((x-0.35, y-0.5), 0.8, 0.3, edgecolor='k',
119                 facecolor=c, fill=True, lw=0.25, alpha=0.5, zorder=1000,
120                 transform=axs.transData
121             )
122         )
123     except Exception as e:
124         print(i.get_text(), e)
125
126 # Add category rectangles
127 fig.patches.extend(category_patches)
128
129 # Create legend elements
130 legend_elements = [
131     Patch(facecolor=v, edgecolor='k',
132         fill=True, lw=0.25, alpha=0.5, label=k)
133             for k, v in lookup.items()
134 ]
135
136 # Add legend
137 axs.legend(handles=legend_elements, loc='upper center',
138     ncol=3, bbox_to_anchor=(0.5, -0.25), fontsize=8,
139     fancybox=False, shadow=False)
140
141 # Format
142 plt.suptitle('URINE - Escherichia Coli')
143 #plt.subplots_adjust(right=0.2)
144 plt.tight_layout()
145
146 # Show
147 plt.show()

Out:
AMEC Invalid RGBA argument: nan
ATEM Invalid RGBA argument: nan
C:\Users\kelda\Desktop\repositories\github\python-spare-code\main\examples\matplotlib\plot_main06_b_heatmap.py:147: UserWarning: FigureCanvasAgg is non-interactive, and thus cannot be shown
Total running time of the script: ( 0 minutes 0.533 seconds)