Note
Click here to download the full example code
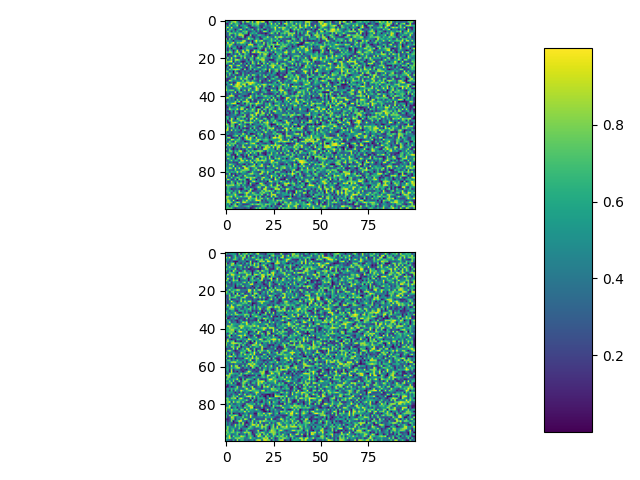
01. 2D array with mpl.imshow
This script provides a basic example of using matplotlib.imshow
to visualize a 2D NumPy array as a raster image. 🖼️ It generates
random data and displays it as a plot, then adds a shared
colorbar to show the value-to-color mapping.
Out:
C:\Users\kelda\Desktop\repositories\github\python-spare-code\main\examples\matplotlib\plot_main01_imshow.py:27: UserWarning:

This figure includes Axes that are not compatible with tight_layout, so results might be incorrect.

C:\Users\kelda\Desktop\repositories\github\python-spare-code\main\examples\matplotlib\plot_main01_imshow.py:30: UserWarning:

FigureCanvasAgg is non-interactive, and thus cannot be shown
11 import matplotlib.pyplot as plt
12 import numpy as np
13
14 # Fixing random state for reproducibility
15 np.random.seed(19680801)
16
17 # Display
18 plt.subplot(211)
19 plt.imshow(np.random.random((100, 100)))
20 plt.subplot(212)
21 plt.imshow(np.random.random((100, 100)))
22
23 # Adjust
24 plt.subplots_adjust(bottom=0.1, right=0.8, top=0.9)
25 cax = plt.axes([0.85, 0.1, 0.075, 0.8])
26 plt.colorbar(cax=cax)
27 plt.tight_layout()
28
29 # Show
30 plt.show()
Total running time of the script: ( 0 minutes 0.172 seconds)