pyamr.utils.plot
Functions
- pyamr.utils.plot.create_mapper(dataframe, column_key, column_value)[source]
This method constructs a mapper
- Parameters:
dataframe (dataframe-like) – The dataframe from which the columns are extracted
column_key (string-like) – The name of the column with the values for the keys of the mapper
column_value (string-like) – The name of the column with the values for the values of the mapper
- Return type:
dictionary
- pyamr.utils.plot.get_category_colors(index, category, cmap='hls')[source]
Creates the colors for the different elements in a given categorical feature vector.
- Parameters:
values (array-like) – The vector with the categorical values
cmap (string-like) – The colormap to use
default (string-like) – The color to be used for the first value. Note that this value needs to appear first on the the sorted list, as such it is recommended to set is as _default.
- Returns:
List of colors.
- Return type:
pd.Series
- pyamr.utils.plot.hlinebgplot(ax, right, yv, bg=None)[source]
This function adds a vertical line and background
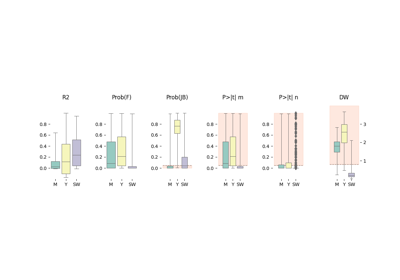
Examples using pyamr.utils.plot.hlinebgplot
- pyamr.utils.plot.scalar_colormap(values, cmap, vmin, vmax)[source]
This method creates a colormap based on values.
- Parameters:
values (array-like)
The values to create the corresponding colors
cmap (str)
The colormap
vmin, vmax (float)
The minimum and maximum possible values
- Return type:
scalar colormap
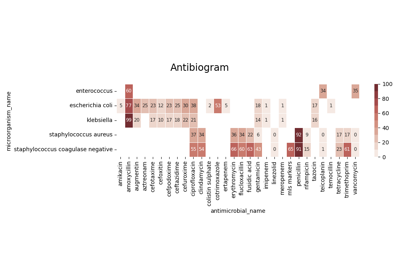
Examples using pyamr.utils.plot.scalar_colormap
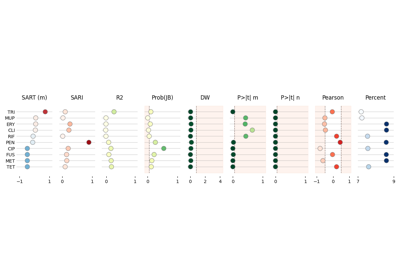
Examples using pyamr.utils.plot.vlinebgplot
Classes
- class pyamr.utils.plot.MidpointNormalize(vmin=None, vmax=None, midpoint=None, clip=False)[source]
Normalise the colorbar so that diverging bars work their way either side from a prescribed midpoint value)
Example
> MidpointNormalize(midpoint=0., vmin=-100, vmax=100)


