Note
Go to the end to download the full example code
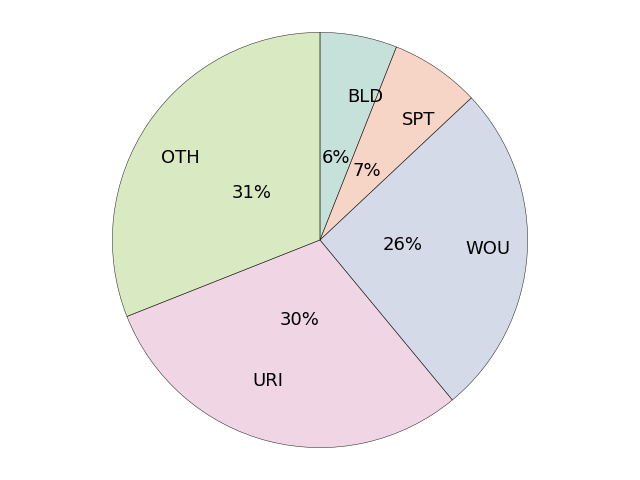
Piechart Cultures
Example using your package

  8 from __future__ import division
  9
 10 # Libraries.
 11 import sys
 12 import numpy as np
 13 import pandas as pd
 14 import seaborn as sns
 15 import matplotlib as mpl
 16 import matplotlib.cm as cm
 17 import matplotlib.pyplot as plt
 18
 19 # Matplotlib font size configuration.
 20 mpl.rcParams['font.size'] = 9.0
 21
 22 # ------------------------------------------------------------------------
 23 #                            HELPER METHODS
 24 # ------------------------------------------------------------------------
 25 def transparency(cmap, alpha):
 26     """
 27     """
 28     for i,rgb in enumerate(cmap):
 29         cmap[i] = rgb + (alpha,)
 30     return cmap
 31
 32 # ------------------------------------------------------------------------
 33 #                            CONFIGURATION
 34 # ------------------------------------------------------------------------
 35 # Common configuration.
 36 title_font_size = 30
 37 labels = ['BLD', 'SPT','WOU', 'URI', 'OTH'] # labels
 38 labels_empty = ['', '', '', '', '']         # labels empty
 39 colors = transparency(sns.color_palette("Set2", desat=0.75, n_colors=7), 0.4)
 40 explode = (0,0,0,0,0)   # proportion with which to offset each wedge
 41 autopct = '%1.0f%%'       # print values inside the wedges
 42 pctdistance = 0.4         # ratio betwen center and text (default=0.6)
 43 labeldistance = 0.7       # radial distance wich pie labels are drawn
 44 shadow = False            # shadow
 45 startangle = 90           # rotate piechart (default=0)
 46 radius = 1                # size of piechart (default=1)
 47 counterclock = False      # fractions direction.
 48 center = (0,0)            # center position of the chart.
 49 frame = False             # plot axes frame with the pie chart.
 50
 51 # map with arguments for the text objects.
 52 textprops = {'fontsize':'x-large'}
 53
 54 # map with arguments for the wedge objects.
 55 wedgeprops = {}
 56
 57 # Color manually selected
 58 colors_manual = ['mediumpurple',
 59                  'violet',
 60                  'mediumaquamarine',
 61                  'lightskyblue',
 62                  'lightsalmon',
 63                  'indianred']
 64
 65
 66
 67
 68 # -------------------------------------------------------------------------
 69 #                              FIGURE 1
 70 # -------------------------------------------------------------------------
 71 # Number of pathology laboratory data for each of the selected biochemical
 72 # markers (ALP, ALT, BIL, CRE, CRP, WBC) for the non-infection category
 73 # during the years 2014 and 2015.
 74
 75 # Portions.
 76 sizes = [6, 7, 26, 30, 31] # Add proportions
 77
 78 # reset feature
 79 startangle = 90
 80
 81 # Plot
 82 plt.figure()
 83 plt.pie(sizes,
 84         explode=explode,
 85         labels=labels,   # Use: labels / labels_empty
 86         colors=colors,   # Use: colors / colors_manual
 87         autopct=autopct,
 88         pctdistance=pctdistance,
 89         labeldistance=labeldistance,
 90         shadow=shadow,
 91         startangle=startangle,
 92         radius=radius,
 93         counterclock=counterclock,
 94         center=center,
 95         frame=frame,
 96         textprops=textprops,
 97         wedgeprops={'linewidth':0.35,
 98                     'edgecolor':'k'})
 99
100 # Format figure.
101 plt.axis('equal')
102 plt.tight_layout()
103 plt.title("", fontsize=title_font_size)          # Add title.
104 #plt.legend(labels=labels, fontsize='xx-large')  # Add legend.
105
106
107 # Show figures
108 plt.show()
Total running time of the script: ( 0 minutes 0.065 seconds)