Note
Go to the end to download the full example code
Plot function
# Code source: Óscar Nájera # License: BSD 3 clause
 9 import numpy as np
10 import matplotlib.pyplot as plt
11
12
13
14 def main():
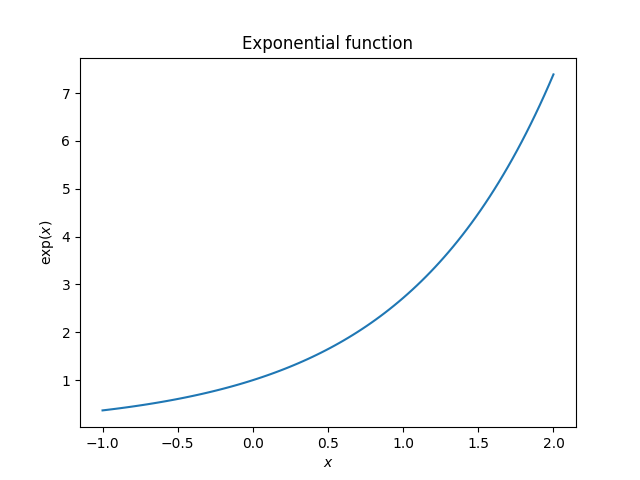
15     x = np.linspace(-1, 2, 100)
16     y = np.exp(x)
17
18     plt.figure()
19     plt.plot(x, y)
20     plt.xlabel('$x$')
21     plt.ylabel(r'$\exp(x)$')
22     plt.title('Exponential function')
23
24     plt.figure()
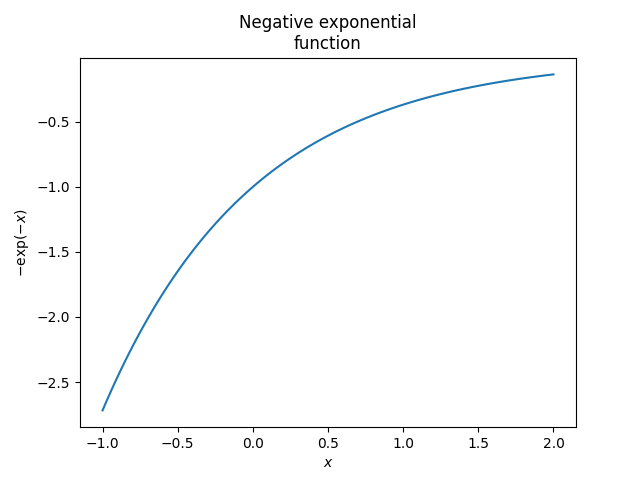
25     plt.plot(x, -np.exp(-x))
26     plt.xlabel('$x$')
27     plt.ylabel(r'$-\exp(-x)$')
28     plt.title('Negative exponential\nfunction')
29     # To avoid matplotlib text output
30     plt.show()
31
32 if __name__ == '__main__':
33     main()
Total running time of the script: ( 0 minutes 0.146 seconds)

