Note
Go to the end to download the full example code
Piechart Completeness
  7 # Libraries.
  8 import numpy as np
  9 import seaborn as sns
 10 import matplotlib as mpl
 11 import matplotlib.cm as cm
 12 import matplotlib.pyplot as plt
 13
 14 # Matplotlib font size configuration.
 15 mpl.rcParams['font.size'] = 9.0
 16
 17 # ------------------------------------------------------------------------
 18 #                            HELPER METHODS
 19 # ------------------------------------------------------------------------
 20 def transparency(cmap, alpha):
 21     """
 22     """
 23     for i,rgb in enumerate(cmap):
 24         cmap[i] = rgb + (alpha,)
 25     return cmap
 26
 27 # ------------------------------------------------------------------------
 28 #                            CONFIGURATION
 29 # ------------------------------------------------------------------------
 30 # Common configuration.
 31 title_font_size = 30
 32 labels = ['P1','P2','P3','P4','P5','P6']    # labels
 33 labels_empty = ['', '', '', '', '', '']     # labels empty
 34 colors = transparency(sns.color_palette("Blues", n_colors=7), 0.75)
 35 colors = colors[1:]       # First color is white...
 36 explode = (0,0,0,0,0,0)   # proportion with which to offset each wedge
 37 autopct = '%1.0f%%'       # print values inside the wedges
 38 pctdistance = 0.5         # ratio betwen center and text (default=0.6)
 39 labeldistance = 0.7       # radial distance wich pie labels are drawn
 40 shadow = False            # shadow.
 41 startangle = 90           # rotate piechart (default=0)
 42 radius = 1                # size of piechart (default=1)
 43 counterclock = False      # fractions direction.
 44 center = (0,0)            # center position of the chart.
 45 frame = False             # plot axes frame with the pie chart.
 46
 47 # map with arguments for the text objects.
 48 textprops = {'fontsize':'x-large'}
 49
 50 # map with arguments for the wedge objects.
 51 wedgeprops = {}
 52
 53 # Color manually selected.
 54 colors_manual = ['mediumpurple',
 55                  'violet',
 56                  'mediumaquamarine',
 57                  'lightskyblue',
 58                  'lightsalmon',
 59                  'indianred']
 60
 61 # ---------------------------------------------------------------------
 62 #                              FIGURE 1
 63 # ---------------------------------------------------------------------
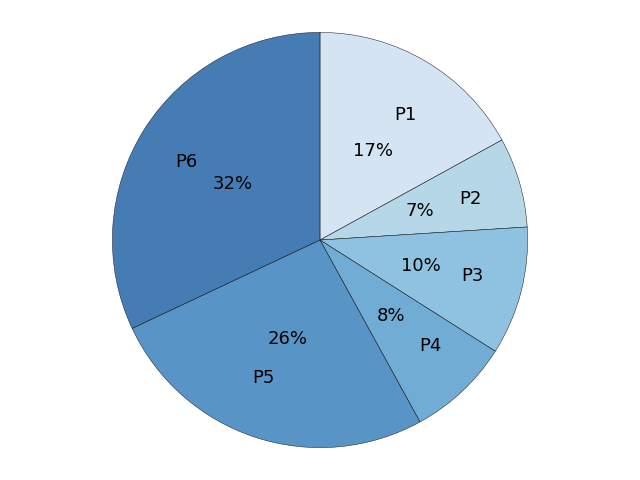
 64 # Number of complege profiles for each of the selected biochemical
 65 # markers (ALP, ALT, BIL, CRE, CRP, WBC) for the non-infection category
 66 # during the years 2014 and 2015.
 67
 68 # Portions.
 69 sizes = [17, 7, 10, 8, 26, 32]               # proportions
 70
 71
 72 # Plot.
 73 plt.figure()
 74 plt.pie(sizes,
 75         explode=explode,
 76         labels=labels,       # Use: labels / labels_empty
 77         colors=colors,       # Use: colors / colors_manual
 78         autopct=autopct,
 79         pctdistance=pctdistance,
 80         labeldistance=labeldistance,
 81         shadow=shadow,
 82         startangle=startangle,
 83         radius=radius,
 84         counterclock=counterclock,
 85         center=center,
 86         frame=frame,
 87         textprops=textprops,
 88         wedgeprops={'linewidth':0.35,
 89                     'edgecolor':'k'})
 90
 91 # Format figure.
 92 plt.axis('equal')
 93 plt.tight_layout()
 94 plt.title("", fontsize=title_font_size)          # Add title.
 95 #plt.legend(labels=labels, fontsize='xx-large')  # Add legend.
 96
 97 # ---------------------------------------------------------------------
 98 #                              FIGURE 2
 99 # ---------------------------------------------------------------------
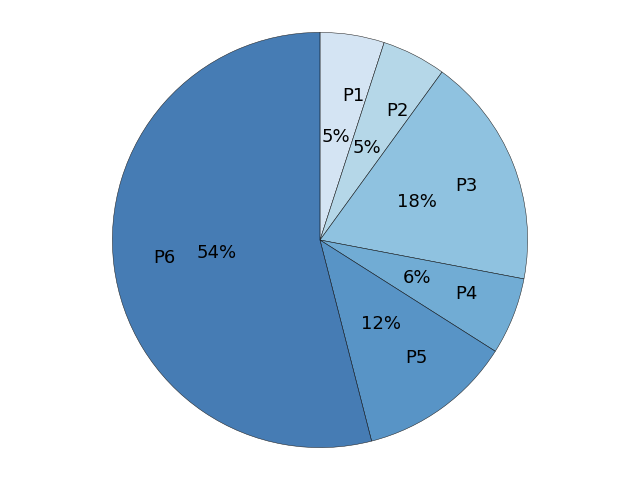
100 # Number of complete profiles for each of the selected biochemical
101 # markers (ALP, ALT, BIL, CRE, CRP, WBC) for the infection category
102 # during the years 2014 and 2015.
103
104 # Portions
105 sizes = [5, 5, 18, 6, 12, 54]                  # proportions
106
107 # Plot.
108 plt.figure()
109 plt.pie(sizes,
110         explode=explode,
111         labels=labels,      # Use: labels / labels_empty
112         colors=colors,      # Use: colors / colors_manual
113         autopct=autopct,
114         pctdistance=pctdistance,
115         labeldistance=labeldistance,
116         shadow=shadow,
117         startangle=startangle,
118         radius=radius,
119         counterclock=counterclock,
120         center=center,
121         frame=frame,
122         textprops=textprops,
123         wedgeprops={'linewidth':0.35,
124                     'edgecolor':'k'})
125
126 # Format figure.
127 plt.axis('equal')
128 plt.tight_layout()
129 plt.title("", fontsize=title_font_size)  # Add title.
130 #plt.legend(labels=labels)               # Add legend.
131
132 # Show graphs.
133 plt.show()
Total running time of the script: ( 0 minutes 0.122 seconds)

