Note
Go to the end to download the full example code
Piechart AMR review
Note
The values can be changed to display other data.
http://matplotlib.org/examples/color/named_colors.html http://matplotlib.org/examples/color/colormaps_reference.html http://matplotlib.org/api/patches_api.html#matplotlib.patches.Wedge http://matplotlib.org/api/text_api.html#matplotlib.text.Text
 15 from __future__ import division
 16
 17 # Libraries
 18 import seaborn as sns
 19 import matplotlib as mpl
 20 import matplotlib.pyplot as plt
 21
 22 # Matplotlib font size configuration.
 23 mpl.rcParams['font.size'] = 9.0
 24
 25
 26 # ------------------------------------------------------------------------
 27 #                            HELPER METHODS
 28 # ------------------------------------------------------------------------
 29 def transparency(cmap, alpha):
 30     """
 31     """
 32     for i,rgb in enumerate(cmap):
 33         cmap[i] = rgb + (alpha,)
 34     return cmap
 35
 36 # ------------------------------------------------------------------------
 37 #                              FIGURE 1
 38 # ------------------------------------------------------------------------
 39 # Common configuration.
 40 title_font_size = 30
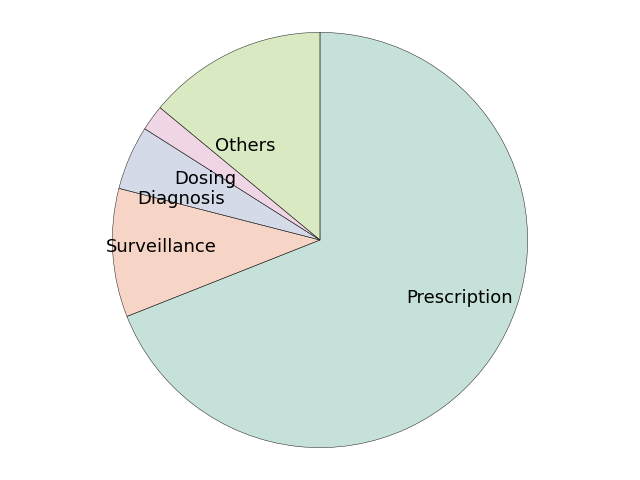
 41 labels = ['Prescription', 'Surveillance','Diagnosis', 'Dosing', 'Others'] # labels
 42 labels_empty = ['', '', '', '', '']         # labels empty
 43 colors = transparency(sns.color_palette("Set2", desat=0.75, n_colors=7), 0.4)
 44 explode = (0.00,0,0,0,0)     # proportion with which to offset each wedge
 45 autopct = ''#'%1.0f%%'       # print values inside the wedges
 46 pctdistance = 0.8         # ratio betwen center and text (default=0.6)
 47 labeldistance = 0.5       # radial distance wich pie labels are drawn
 48 shadow = False            # shadow
 49 startangle = 90           # rotate piechart (default=0)
 50 radius = 1                # size of piechart (default=1)
 51 counterclock = False      # fractions direction.
 52 center = (0,0)            # center position of the chart.
 53 frame = False             # plot axes frame with the pie chart.
 54
 55 # map with arguments for the text objects.
 56 textprops = {'fontsize':'x-large'}
 57
 58 # map with arguments for the wedge objects.
 59 wedgeprops = {}
 60
 61 # Color manually selected
 62 colors_manual = ['mediumpurple',
 63                  'violet',
 64                  'mediumaquamarine',
 65                  'lightskyblue',
 66                  'lightsalmon',
 67                  'indianred']
 68
 69 # ---------------------------
 70 #  plot
 71 # ---------------------------
 72 # Portions.
 73 sizes = [69, 10, 5, 2, 14] # Add proportions
 74
 75 # reset feature
 76 startangle = 90
 77
 78 # Plot
 79 plt.figure()
 80 plt.pie(sizes,
 81         explode=explode,
 82         labels=labels,   # Use: labels / labels_empty
 83         colors=colors,   # Use: colors / colors_manual
 84         autopct=autopct,
 85         pctdistance=pctdistance,
 86         labeldistance=labeldistance,
 87         shadow=shadow,
 88         startangle=startangle,
 89         radius=radius,
 90         counterclock=counterclock,
 91         center=center,
 92         frame=frame,
 93         textprops=textprops,
 94         wedgeprops={'linewidth':0.35,
 95                     'edgecolor':'k'})
 96
 97 # Format figure.
 98 plt.axis('equal')
 99 plt.tight_layout()
100 plt.title("", fontsize=title_font_size)          # Add title.
101 #plt.legend(labels=labels, fontsize='xx-large')  # Add legend.
102
103
104 # ------------------------------------------------------------------------
105 #                            FIGURE 2
106 # ------------------------------------------------------------------------
107 # Common configuration.
108 title_font_size = 30
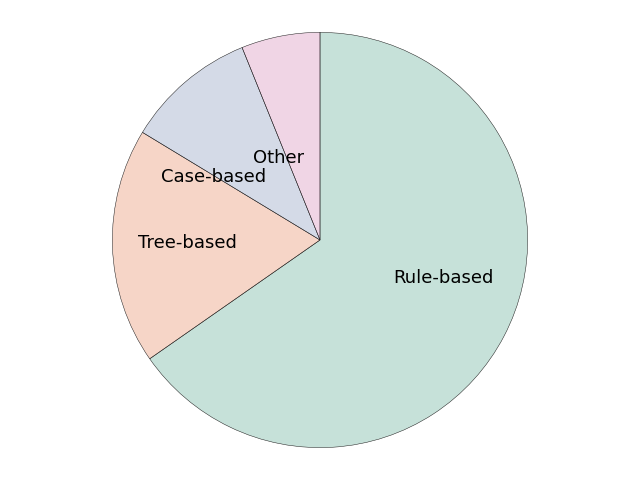
109 labels = ['Rule-based', 'Tree-based','Case-based', 'Other'] # labels
110 labels_empty = ['', '', '', '']         # labels empty
111 colors = transparency(sns.color_palette("Set2", desat=0.75, n_colors=7), 0.4)
112 explode = (0.00,0,0,0)     # proportion with which to offset each wedge
113 autopct = ''#'%1.0f%%'       # print values inside the wedges
114 pctdistance = 0.6         # ratio betwen center and text (default=0.6)
115 labeldistance = 0.4       # radial distance wich pie labels are drawn
116 shadow = False            # shadow
117 startangle = 90           # rotate piechart (default=0)
118 radius = 1                # size of piechart (default=1)
119 counterclock = False      # fractions direction.
120 center = (0,0)            # center position of the chart.
121 frame = False             # plot axes frame with the pie chart.
122
123 # map with arguments for the text objects.
124 textprops = {'fontsize':'x-large'}
125
126 # map with arguments for the wedge objects.
127 wedgeprops = {}
128
129 # Color manually selected
130 colors_manual = ['mediumpurple',
131                  'violet',
132                  'mediumaquamarine',
133                  'lightskyblue',
134                  'lightsalmon',
135                  'indianred']
136
137 # ---------------------------
138 #  plot
139 # ---------------------------
140 # Portions.
141 sizes = [64, 18, 10, 6] # Add proportions
142
143 # reset feature
144 startangle = 90
145
146 # Plot
147 plt.figure()
148 plt.pie(sizes,
149         explode=explode,
150         labels=labels,   # Use: labels / labels_empty
151         colors=colors,   # Use: colors / colors_manual
152         autopct=autopct,
153         pctdistance=pctdistance,
154         labeldistance=labeldistance,
155         shadow=shadow,
156         startangle=startangle,
157         radius=radius,
158         counterclock=counterclock,
159         center=center,
160         frame=frame,
161         textprops=textprops,
162         wedgeprops={'linewidth':0.35,
163                     'edgecolor':'k'})
164
165 # Format figure.
166 plt.axis('equal')
167 plt.tight_layout()
168 plt.title("", fontsize=title_font_size)          # Add title.
169 #plt.legend(labels=labels, fontsize='xx-large')  # Add legend.
170
171 # ------------------------------------------------------------------------
172 #                            FIGURE 3
173 # ------------------------------------------------------------------------
174 # Common configuration.
175 title_font_size = 30
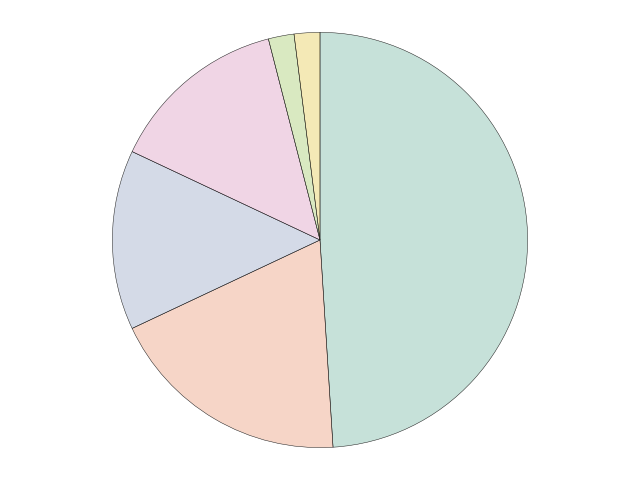
176 labels = ['Bacteremia', 'SSI','UTI', 'RTI' ' C+', 'Gram'] # labels
177 labels_empty = ['', '', '', '', '', '']         # labels empty
178 colors = transparency(sns.color_palette("Set2", desat=0.75, n_colors=7), 0.4)
179 explode = (0.00,0,0,0,0,0) # proportion with which to offset each wedge
180 autopct = ''#'%1.0f%%'    # print values inside the wedges
181 pctdistance = 0.6         # ratio betwen center and text (default=0.6)
182 labeldistance = 0.4       # radial distance wich pie labels are drawn
183 shadow = False            # shadow
184 startangle = 90           # rotate piechart (default=0)
185 radius = 1                # size of piechart (default=1)
186 counterclock = False      # fractions direction.
187 center = (0,0)            # center position of the chart.
188 frame = False             # plot axes frame with the pie chart.
189
190 # map with arguments for the text objects.
191 textprops = {'fontsize':'x-large'}
192
193 # map with arguments for the wedge objects.
194 wedgeprops = {}
195
196 # Color manually selected
197 colors_manual = ['mediumpurple',
198                  'violet',
199                  'mediumaquamarine',
200                  'lightskyblue',
201                  'lightsalmon',
202                  'indianred']
203
204 # ---------------------------
205 #  plot
206 # ---------------------------
207 # Portions.
208 sizes = [49, 19, 14, 14, 2, 2] # Add proportions
209
210 # reset feature
211 startangle = 90
212
213 # Plot
214 plt.figure()
215 plt.pie(sizes,
216         explode=explode,
217         labels=labels_empty,   # Use: labels / labels_empty
218         colors=colors,   # Use: colors / colors_manual
219         autopct=autopct,
220         pctdistance=pctdistance,
221         labeldistance=labeldistance,
222         shadow=shadow,
223         startangle=startangle,
224         radius=radius,
225         counterclock=counterclock,
226         center=center,
227         frame=frame,
228         textprops=textprops,
229         wedgeprops={'linewidth':0.35,
230                     'edgecolor':'k'})
231
232 # Format figure.
233 plt.axis('equal')
234 plt.tight_layout()
235 plt.title("", fontsize=title_font_size)          # Add title.
236 #plt.legend(labels=labels, fontsize='xx-large')  # Add legend.
237
238
239 # Show figures
240 plt.show()
Total running time of the script: ( 0 minutes 0.163 seconds)


