Note
Go to the end to download the full example code
WLS - Search
c:\users\kelda\desktop\repositories\virtualenvs\venv-py391-pyamr\lib\site-packages\statsmodels\regression\linear_model.py:807: RuntimeWarning:

divide by zero encountered in log

c:\users\kelda\desktop\repositories\virtualenvs\venv-py391-pyamr\lib\site-packages\statsmodels\regression\linear_model.py:807: RuntimeWarning:

divide by zero encountered in log

c:\users\kelda\desktop\repositories\virtualenvs\venv-py391-pyamr\lib\site-packages\statsmodels\regression\linear_model.py:807: RuntimeWarning:

divide by zero encountered in log

c:\users\kelda\desktop\repositories\virtualenvs\venv-py391-pyamr\lib\site-packages\statsmodels\regression\linear_model.py:807: RuntimeWarning:

divide by zero encountered in log

c:\users\kelda\desktop\repositories\virtualenvs\venv-py391-pyamr\lib\site-packages\statsmodels\regression\linear_model.py:807: RuntimeWarning:

divide by zero encountered in log


Grid search:
                            0              1              2              3              4              5
wls-rsquared           0.7508         0.5715         0.5383         0.4427         0.4913         0.2871
wls-rsquare...         0.7482         0.5671         0.5336          0.437         0.4861         0.2798
wls-fvalue           295.1824       130.6808       114.2534        77.8336        94.6547         39.463
wls-fprob                 0.0            0.0            0.0            0.0            0.0            0.0
wls-aic             1127.8602            inf            inf            inf            inf            inf
wls-bic             1133.0705            inf            inf            inf            inf            inf
wls-llf             -561.9301           -inf           -inf           -inf           -inf           -inf
wls-mse_model    1340457.1185     178972.628    137413.0249     76234.7768     74119.1589       21463.64
wls-mse_resid       4541.1139      1369.5401       1202.704       979.4588       783.0477       543.8925
wls-mse_total       18035.215      3163.5107      2578.5658      1739.6135      1523.8165        755.203
wls-const_coef       169.0879       259.2213        274.591       314.9257       300.5514       381.1919
wls-const_std         13.3771        16.5491        16.5363        15.9253         16.066        12.4215
wls-const_t...        12.6401        15.6638        16.6053        19.7752        18.7073         30.688
wls-const_t...            0.0            0.0            0.0            0.0            0.0            0.0
wls-const_cil        142.5415       226.3802       241.7752       283.3224        268.669       356.5418
wls-const_ciu        195.6343       292.0624       307.4068       346.5289       332.4338        405.842
wls-x1_coef            4.0109         2.6599         2.4545         1.9319         2.1034         1.0746
wls-x1_std             0.2334         0.2327         0.2296          0.219         0.2162         0.1711
wls-x1_tvalue         17.1809        11.4316        10.6889         8.8223         9.7291          6.282
wls-x1_tprob              0.0            0.0            0.0            0.0            0.0            0.0
wls-x1_cil             3.5476         2.1981         1.9988         1.4973         1.6744         0.7352
wls-x1_ciu             4.4741         3.1216         2.9102         2.3664         2.5325         1.4141
wls-s_dw                 0.22          0.426          0.479          0.633          0.605          0.891
wls-s_jb_value          4.002         11.477         12.933         17.487         13.908         20.172
wls-s_jb_prob           0.135         0.0032         0.0015         0.0002          0.001            0.0
wls-s_skew              0.489          0.532          0.544          0.654          0.596          0.418
wls-s_kurtosis          2.935          4.274          4.386          4.577          4.384          5.035
wls-s_omnib...          4.163          9.688         10.389          13.19         11.283         11.307
wls-s_omnib...          0.125          0.008          0.006          0.001          0.004          0.004
wls-m_dw               0.2198         0.1507         0.1349         0.0995         0.1111         0.0615
wls-m_jb_value         4.0017         7.8715        10.8827        16.8792        15.2715        19.8386
wls-m_jb_prob          0.1352         0.0195         0.0043         0.0002         0.0005            0.0
wls-m_skew             0.4889        -0.6401        -0.7696        -0.9868         -0.932         -1.089
wls-m_kurtosis         2.9346         3.5001         3.4926         3.3949         3.4364         3.1338
wls-m_nm_value         4.1633         8.2523         10.723        14.9411        13.9033        16.4058
wls-m_nm_prob          0.1247         0.0161         0.0047         0.0006          0.001         0.0003
wls-m_ks_value           0.55           0.58         0.6195         0.6699         0.6092         0.6998
wls-m_ks_prob             0.0            0.0            0.0            0.0            0.0            0.0
wls-m_shp_v...         0.9703         0.9297         0.9143         0.8843         0.8922          0.862
wls-m_shp_prob         0.0233            0.0            0.0            0.0            0.0            0.0
wls-m_ad_value         1.0302         3.2026         3.9394         5.2416         4.9361         5.7562
wls-m_ad_nnorm          False          False          False          False          False          False
wls-exog        [[1.0, 0.0...  [[1.0, 0.0...  [[1.0, 0.0...  [[1.0, 0.0...  [[1.0, 0.0...  [[1.0, 0.0...
wls-endog       [49.650303...  [49.650303...  [49.650303...  [49.650303...  [49.650303...  [49.650303...
wls-trend                   c              c              c              c              c              c
wls-weights     [1.0, 1.0,...  [0.0657166...  [0.0447889...  [0.0156449...  [0.0189971...  [1.9369381...
wls-W           <statsmode...  <pyamr.met...  <pyamr.met...  <pyamr.met...  <pyamr.met...  <pyamr.met...
wls-model       <statsmode...  <statsmode...  <statsmode...  <statsmode...  <statsmode...  <statsmode...
wls-id          WLS(c,Leas...  WLS(c,Sig(...  WLS(c,Sig(...  WLS(c,Sig(...  WLS(c,Sig(...  WLS(c,Sig(...
6 # Import class.
7 import sys
8 import numpy as np
9 import pandas as pd
10 import matplotlib as mpl
11 import matplotlib.pyplot as plt
12 import statsmodels.api as sm
13 import statsmodels.robust.norms as norms
14
15 # import weights.
16 from pyamr.datasets.load import make_timeseries
17 from pyamr.core.regression.wls import WLSWrapper
18 from pyamr.metrics.weights import SigmoidA
19
20 # ----------------------------
21 # set basic configuration
22 # ----------------------------
23 # Matplotlib options
24 mpl.rc('legend', fontsize=6)
25 mpl.rc('xtick', labelsize=6)
26 mpl.rc('ytick', labelsize=6)
27
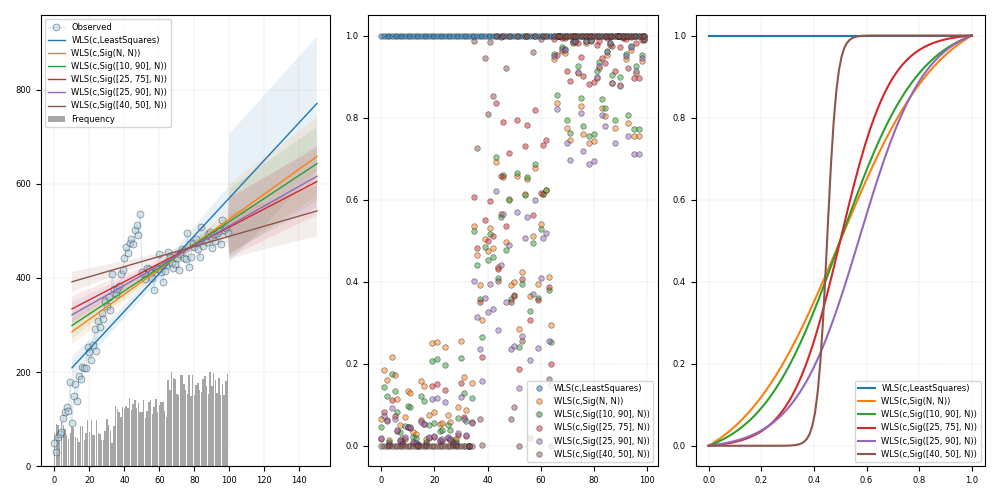
28 # Set pandas configuration.
29 pd.set_option('display.max_colwidth', 14)
30 pd.set_option('display.width', 150)
31 pd.set_option('display.precision', 4)
32
33 # ----------------------------
34 # create data
35 # ----------------------------
36 # Create timeseries data
37 x, y, f = make_timeseries()
38
39 # -----------------------------
40 # Example II
41 # -----------------------------
42 # This example performs grid search on a number of possible configurations
43 # of the WLSWrapper. In particular, it tests the effect of different
44 # objects to compute the weights from the frequencies. It presents both
45 # the resulting pandas dataframe and also a figure.
46
47 # Configuration
48 # -------------
49 # This variable contains the weight functions to test. Note that in
50 # the norms module there are other options such as [norms.HuberT(),
51 # norms.Hampel(), norms.TrimmedMean(), norms.TukeyBiweight(),
52 # norms.AndreWave(), norms.RamsayE()]
53 w_func = [
54 norms.LeastSquares(),
55 SigmoidA(r=200, g=0.5, offset=0.0, scale=1.0),
56 SigmoidA(r=200, g=0.5, offset=0.0, scale=1.0, percentiles=[10, 90]),
57 SigmoidA(r=200, g=0.5, offset=0.0, scale=1.0, percentiles=[25, 75]),
58 SigmoidA(r=200, g=0.5, offset=0.0, scale=1.0, percentiles=[25, 90]),
59 SigmoidA(r=200, g=0.5, offset=0.0, scale=1.0, percentiles=[40, 50])]
60
61 # The grid search parameters.
62 grid_params = [
63 # {'exog': [x], 'endog': [y], 'trend': ['c']},
64 {'exog': [x], 'endog': [y], 'trend': ['c'], 'weights': [f], 'W': w_func}
65 ]
66
67 # Grid search
68 # ------------
69 # Perform grid search.
70 summary = WLSWrapper(estimator=sm.WLS) \
71 .grid_search(grid_params=grid_params)
72
73 # Show grid results
74 # ..todo: It is weird to create an WLSWrapper jut to
75 # be able to use themethod from_list_dataframe.
76 # try to implemented separately.
77 print("\nGrid search:")
78 print(WLSWrapper().from_list_dataframe(summary).T)
79
80 # Prediction
81 # ----------
82 # Variables.
83 start, end = 10, 150
84
85 # Create figure
86 fig, axes = plt.subplots(1, 3, figsize=(10, 5))
87
88 # Plot truth values.
89 axes[0].plot(x, y, color='#A6CEE3', alpha=0.5, marker='o',
90 markeredgecolor='k', markeredgewidth=0.5,
91 markersize=5, linewidth=0.75, label='Observed')
92
93 # Plot frequencies
94 axes[0].bar(x, f, color='gray', alpha=0.7, label='Frequency')
95
96 # For each of the models in summary
97 for i, model in enumerate(summary):
98
99 # Compute predictions.
100 preds = model.get_prediction(start=start, end=end)
101
102 # Plot forecasted values.
103 axes[0].plot(preds[0, :], preds[1, :],
104 linewidth=1.0,
105 label=model._identifier(short=True))
106
107 # Plot the confidence intervals.
108 axes[0].fill_between(preds[0, :],
109 preds[2, :],
110 preds[3, :],
111 alpha=0.1)
112
113 # Plot weights assigned to each observation
114 axes[1].plot(model.weights, marker='o', alpha=0.5,
115 markeredgecolor='k', markeredgewidth=0.5,
116 markersize=4, linewidth=0.00,
117 label=model._identifier(short=True))
118
119 # Plot weights converter (W) functions.
120 if model.W is not None:
121 axes[2].plot(np.linspace(0, 1, 100),
122 model.W.weights(np.linspace(0, 1, 100)),
123 label=model._identifier(short=True))
124
125 # Grid.
126 axes[0].grid(linestyle='--', linewidth=0.35, alpha=0.5)
127 axes[1].grid(linestyle='--', linewidth=0.35, alpha=0.5)
128 axes[2].grid(linestyle='--', linewidth=0.35, alpha=0.5)
129
130 # Legend.
131 axes[0].legend(loc=0)
132 axes[1].legend(loc=0)
133 axes[2].legend(loc=0)
134
135 # Tight layout
136 plt.tight_layout()
137
138 # Show.
139 plt.show()
Total running time of the script: ( 0 minutes 0.539 seconds)