Note
Go to the end to download the full example code
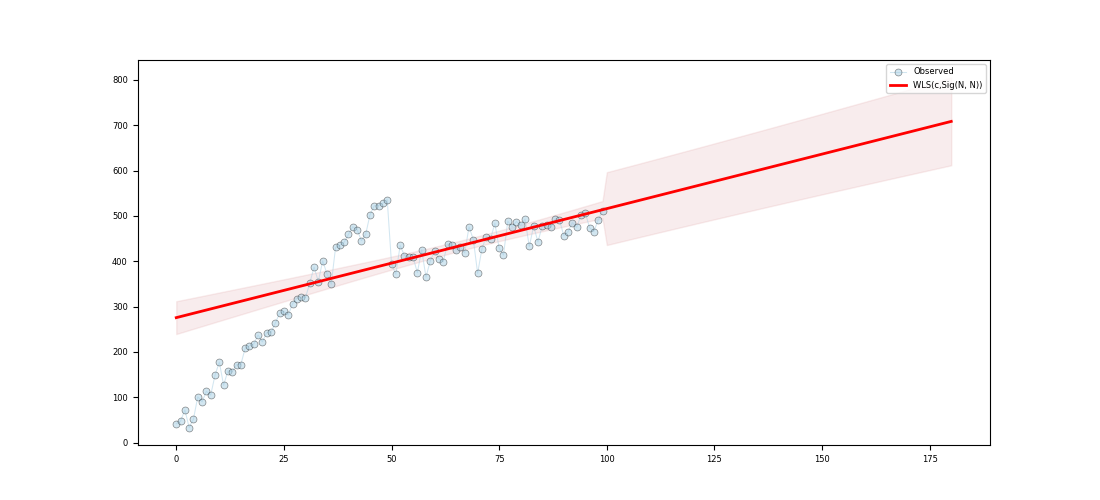
WLS - Basic

c:\users\kelda\desktop\repositories\virtualenvs\venv-py391-pyamr\lib\site-packages\statsmodels\regression\linear_model.py:807: RuntimeWarning:

divide by zero encountered in log


Series:
wls-rsquared                  0.4773
wls-rsquared_adj               0.472
wls-fvalue                   89.4894
wls-fprob                        0.0
wls-aic                          inf
wls-bic                          inf
wls-llf                         -inf
wls-mse_model            137903.9406
wls-mse_resid               1541.008
wls-mse_total              2918.4114
wls-const_coef              275.6131
wls-const_std                18.2135
wls-const_tvalue             15.1324
wls-const_tprob                  0.0
wls-const_cil                239.469
wls-const_ciu               311.7571
wls-x1_coef                    2.405
wls-x1_std                    0.2542
wls-x1_tvalue                 9.4599
wls-x1_tprob                     0.0
wls-x1_cil                    1.9005
wls-x1_ciu                    2.9095
wls-s_dw                       0.488
wls-s_jb_value                 7.949
wls-s_jb_prob                 0.0188
wls-s_skew                     0.566
wls-s_kurtosis                 3.791
wls-s_omnibus_value            8.126
wls-s_omnibus_prob             0.017
wls-m_dw                      0.1295
wls-m_jb_value                6.1737
wls-m_jb_prob                 0.0456
wls-m_skew                   -0.5865
wls-m_kurtosis                 3.325
wls-m_nm_value                6.6625
wls-m_nm_prob                 0.0357
wls-m_ks_value                0.5736
wls-m_ks_prob                    0.0
wls-m_shp_value               0.9415
wls-m_shp_prob                0.0002
wls-m_ad_value                2.4991
wls-m_ad_nnorm                 False
wls-missing                    raise
wls-exog               [[1.0, 0.0...
wls-endog              [41.719565...
wls-trend                          c
wls-weights            [0.0435648...
wls-W                  <pyamr.met...
wls-model              <statsmode...
wls-id                 WLS(c,Sig(...
dtype: object

Regression line:
[275.61 278.02 280.42 282.83 285.23 287.64 290.04 292.45 294.85 297.26]

Summary:
                            WLS Regression Results
==============================================================================
Dep. Variable:                      y   R-squared:                       0.477
Model:                            WLS   Adj. R-squared:                  0.472
Method:                 Least Squares   F-statistic:                     89.49
Date:                Thu, 15 Jun 2023   Prob (F-statistic):           1.80e-15
Time:                        18:19:13   Log-Likelihood:                   -inf
No. Observations:                 100   AIC:                               inf
Df Residuals:                      98   BIC:                               inf
Df Model:                           1
Covariance Type:            nonrobust
==============================================================================
                 coef    std err          t      P>|t|      [0.025      0.975]
------------------------------------------------------------------------------
const        275.6131     18.213     15.132      0.000     239.469     311.757
x1             2.4050      0.254      9.460      0.000       1.900       2.910
==============================================================================
Omnibus:                        8.126   Durbin-Watson:                   0.488
Prob(Omnibus):                  0.017   Jarque-Bera (JB):                7.949
Skew:                           0.566   Prob(JB):                       0.0188
Kurtosis:                       3.791   Cond. No.                         234.
Normal (N):                     6.662   Prob(N):                         0.036
==============================================================================
  6 # Import class.
  7 import sys
  8 import numpy as np
  9 import pandas as pd
 10 import matplotlib as mpl
 11 import matplotlib.pyplot as plt
 12 import statsmodels.api as sm
 13 import statsmodels.robust.norms as norms
 14
 15 # import weights.
 16 from pyamr.datasets.load import make_timeseries
 17 from pyamr.core.regression.wls import WLSWrapper
 18 from pyamr.metrics.weights import SigmoidA
 19
 20 # ----------------------------
 21 # set basic configuration
 22 # ----------------------------
 23 # Matplotlib options
 24 mpl.rc('legend', fontsize=6)
 25 mpl.rc('xtick', labelsize=6)
 26 mpl.rc('ytick', labelsize=6)
 27
 28 # Set pandas configuration.
 29 pd.set_option('display.max_colwidth', 14)
 30 pd.set_option('display.width', 150)
 31 pd.set_option('display.precision', 4)
 32
 33 # ----------------------------
 34 # create data
 35 # ----------------------------
 36 # Create timeseries data
 37 x, y, f = make_timeseries()
 38
 39 # Create method to compute weights from frequencies
 40 W = SigmoidA(r=200, g=0.5, offset=0.0, scale=1.0)
 41
 42 # Note that the function fit will call M.weights(weights) inside and will
 43 # store the M converter in the instance. Therefore, the code execute is
 44 # equivalent to <weights=M.weights(f)> with the only difference being that
 45 # the weight converter is not saved.
 46 wls = WLSWrapper(estimator=sm.WLS).fit( \
 47     exog=x, endog=y, trend='c', weights=f,
 48     W=W, missing='raise')
 49
 50 # Print series.
 51 print("\nSeries:")
 52 print(wls.as_series())
 53
 54 # Print regression line.
 55 print("\nRegression line:")
 56 print(wls.line(np.arange(10)))
 57
 58 # Print summary.
 59 print("\nSummary:")
 60 print(wls.as_summary())
 61
 62 # -----------------
 63 # Save & Load
 64 # -----------------
 65 # File location
 66 #fname = '../../examples/saved/wls-sample.pickle'
 67
 68 # Save
 69 #wls.save(fname=fname)
 70
 71 # Load
 72 #wls = WLSWrapper().load(fname=fname)
 73
 74 # -------------
 75 #  Example I
 76 # -------------
 77 # This example shows how to make predictions using the wrapper and how
 78 # to plot the resultin data. In addition, it compares the intervales
 79 # provided by get_prediction (confidence intervals) and the intervals
 80 # provided by wls_prediction_std (prediction intervals).
 81 #
 82 # To Do: Implement methods to compute CI and PI (see regression).
 83
 84 # Variables.
 85 start, end = None, 180
 86
 87 # Compute predictions (exogenous?). It returns a 2D array
 88 # where the rows contain the time (t), the mean, the lower
 89 # and upper confidence (or prediction?) interval.
 90 preds = wls.get_prediction(start=start, end=end)
 91
 92
 93 # Create figure
 94 fig, ax = plt.subplots(1, 1, figsize=(11,5))
 95
 96 # Plotting confidence intervals
 97 # -----------------------------
 98 # Plot truth values.
 99 ax.plot(x, y, color='#A6CEE3', alpha=0.5, marker='o',
100               markeredgecolor='k', markeredgewidth=0.5,
101               markersize=5, linewidth=0.75, label='Observed')
102
103 # Plot forecasted values.
104 ax.plot(preds[0,:], preds[1, :], color='#FF0000', alpha=1.00,
105                 linewidth=2.0, label=wls._identifier(short=True))
106
107 # Plot the confidence intervals.
108 ax.fill_between(preds[0, :], preds[2, :],
109                              preds[3, :],
110                              color='r',
111                              alpha=0.1)
112
113 # Legend
114 plt.legend()
115
116 # Show
117 plt.show()
Total running time of the script: ( 0 minutes 0.114 seconds)