Note
Go to the end to download the full example code
ARIMA - Basic

Series:
arima-aic                   768.7153
arima-bic                   775.8614
arima-hqic                  771.5804
arima-llf                  -381.3576
arima-const_coef            285.1589
arima-const_std             139.2149
arima-const_tvalue            2.0483
arima-const_tprob             0.0405
arima-const_cil              12.3026
arima-const_ciu             558.0151
arima-ar.L1_coef              0.9891
arima-ar.L1_std               0.0196
arima-ar.L1_tvalue           50.4377
arima-ar.L1_tprob                0.0
arima-ar.L1_cil               0.9507
arima-ar.L1_ciu               1.0275
arima-sigma2_coef           771.4041
arima-sigma2_std            144.7181
arima-sigma2_tvalue           5.3304
arima-sigma2_tprob               0.0
arima-sigma2_cil            487.7618
arima-sigma2_ciu           1055.0465
arima-m_dw                    1.6384
arima-m_jb_value           1249.5817
arima-m_jb_prob                  0.0
arima-m_skew                 -3.2238
arima-m_kurtosis             21.2566
arima-m_nm_value             87.3962
arima-m_nm_prob                  0.0
arima-m_ks_value                0.55
arima-m_ks_prob                  0.0
arima-m_shp_value             0.7607
arima-m_shp_prob                 0.0
arima-m_ad_value              2.5097
arima-m_ad_nnorm               False
arima-converged                 True
arima-endog            [43.200454...
arima-order                (1, 0, 0)
arima-trend                        c
arima-disp                         0
arima-model            <statsmode...
arima-id               ARIMA(1, 0...
dtype: object

Summary:
                               SARIMAX Results
==============================================================================
Dep. Variable:                      y   No. Observations:                   80
Model:                 ARIMA(1, 0, 0)   Log Likelihood                -381.358
Date:                Thu, 15 Jun 2023   AIC                            768.715
Time:                        18:17:11   BIC                            775.861
Sample:                             0   HQIC                           771.580
                                 - 80
Covariance Type:                  opg
==============================================================================
                 coef    std err          z      P>|z|      [0.025      0.975]
------------------------------------------------------------------------------
const        285.1589    139.215      2.048      0.041      12.303     558.015
ar.L1          0.9891      0.020     50.438      0.000       0.951       1.028
sigma2       771.4041    144.718      5.330      0.000     487.762    1055.046
==============================================================================
                                    Manual
------------------------------------------------------------------------------
Omnibus:                        0.000  Durbin-Watson:                    1.638
Prob(Omnibus):                  0.000  Jarque-Bera (JB):              1249.582
Skew:                          -3.224  Prob(JB):                         0.000
Kurtosis_m:                    21.257  Cond No:
Normal (N):                    87.396  Prob(N):                          0.000
==============================================================================
  6 # Import.
  7 import sys
  8 import warnings
  9 import pandas as pd
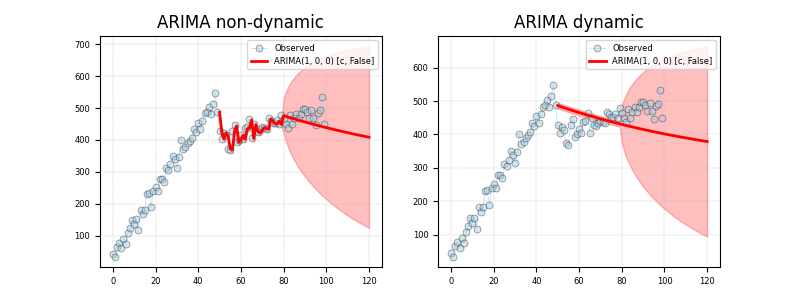
 10 import matplotlib as mpl
 11 import matplotlib.pyplot as plt
 12
 13 # Import ARIMA from statsmodels.
 14 from statsmodels.tsa.arima.model import ARIMA
 15
 16 # import weights.
 17 from pyamr.datasets.load import make_timeseries
 18 from pyamr.core.regression.arima import ARIMAWrapper
 19
 20 # Filter warnings
 21 warnings.simplefilter(action='ignore', category=FutureWarning)
 22
 23 # ----------------------------
 24 # set basic configuration
 25 # ----------------------------
 26 # Matplotlib options
 27 mpl.rc('legend', fontsize=6)
 28 mpl.rc('xtick', labelsize=6)
 29 mpl.rc('ytick', labelsize=6)
 30
 31 # Set pandas configuration.
 32 pd.set_option('display.max_colwidth', 14)
 33 pd.set_option('display.width', 150)
 34 pd.set_option('display.precision', 4)
 35
 36 # ----------------------------
 37 # create data
 38 # ----------------------------
 39 # Create timeseries data
 40 x, y, f = make_timeseries()
 41
 42 # Create exogenous variable
 43 exog = x
 44
 45 # ----------------------------
 46 # fit the model
 47 # ----------------------------
 48 # Create specific arima model.
 49 arima = ARIMAWrapper(estimator=ARIMA).fit( \
 50     endog=y[:80], order=(1,0,0), trend='c', disp=0)
 51
 52 # Print series
 53 print("\nSeries:")
 54 print(arima.as_series())
 55
 56 # Print summary.
 57 print("\nSummary:")
 58 print(arima.as_summary())
 59
 60 # -----------------
 61 # Save & Load
 62 # -----------------
 63 # File location
 64 #fname = '../../examples/saved/arima-sample.pickle'
 65
 66 # Save
 67 #arima.save(fname=fname)
 68
 69 # Load
 70 #arima = ARIMAWrapper().load(fname=fname)
 71
 72
 73 # -----------------
 74 #  Predict and plot
 75 # -----------------
 76 # This example shows how to make predictions using the wrapper which has
 77 # been previously fitted. It also demonstrateds how to plot the resulting
 78 # data for visualization purposes. It shows two different types of
 79 # predictions:
 80 #    - dynamic predictions in which the prediction is done based on the
 81 #      previously predicted values. Note that for the case of ARIMA(0,1,1)
 82 #      it returns a line.
 83 #    - not dynamic in which the prediction is done based on the real
 84 #      values of the time series, no matter what the prediction was for
 85 #      those values.
 86
 87 # Variables.
 88 s, e = 50, 120
 89
 90 # Compute predictions
 91 preds_1 = arima.get_prediction(start=s, end=e, dynamic=False)
 92 preds_2 = arima.get_prediction(start=s, end=e, dynamic=True)
 93
 94 # Create figure
 95 fig, axes = plt.subplots(1, 2, figsize=(8,3))
 96
 97 # ----------------
 98 # Plot non-dynamic
 99 # ----------------
100 # Plot truth values.
101 axes[0].plot(y, color='#A6CEE3', alpha=0.5, marker='o',
102                 markeredgecolor='k', markeredgewidth=0.5,
103                 markersize=5, linewidth=0.75, label='Observed')
104
105 # Plot forecasted values.
106 axes[0].plot(preds_1[0,:], preds_1[1,:], color='#FF0000', alpha=1.00,
107             linewidth=2.0, label=arima._identifier())
108
109 # Plot the confidence intervals.
110 axes[0].fill_between(preds_1[0,:], preds_1[2,:],
111                                    preds_1[3,:],
112                                    color='#FF0000',
113                                    alpha=0.25)
114
115 # ------------
116 # Plot dynamic
117 # ------------
118 # Plot truth values.
119 axes[1].plot(y, color='#A6CEE3', alpha=0.5, marker='o',
120                 markeredgecolor='k', markeredgewidth=0.5,
121                 markersize=5, linewidth=0.75, label='Observed')
122
123 # Plot forecasted values.
124 axes[1].plot(preds_2[0,:], preds_2[1,:], color='#FF0000', alpha=1.00,
125             linewidth=2.0, label=arima._identifier())
126
127 # Plot the confidence intervals.
128 axes[1].fill_between(preds_2[0,:], preds_2[2,:],
129                                    preds_2[3,:],
130                                    color='#FF0000',
131                                    alpha=0.25)
132
133 # Configure axes
134 axes[0].set_title("ARIMA non-dynamic")
135 axes[1].set_title("ARIMA dynamic")
136
137 # Format axes
138 axes[0].grid(True, linestyle='--', linewidth=0.25)
139 axes[1].grid(True, linestyle='--', linewidth=0.25)
140
141 # Legend
142 axes[0].legend()
143 axes[1].legend()
144
145 # Show
146 plt.show()
Total running time of the script: ( 0 minutes 0.174 seconds)