Note
Click here to download the full example code
05c. Custom using swarmplot
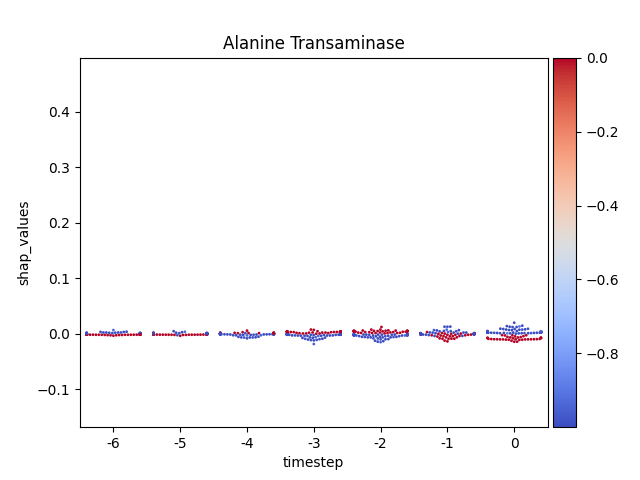
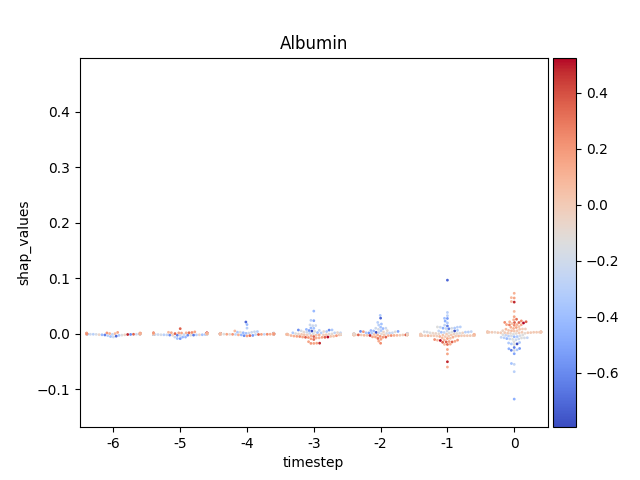
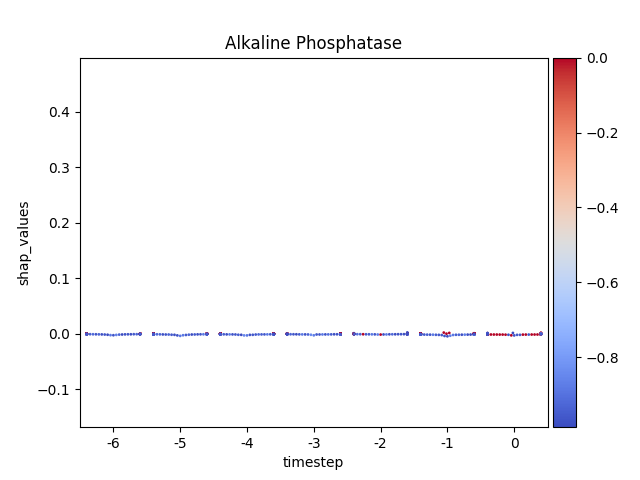
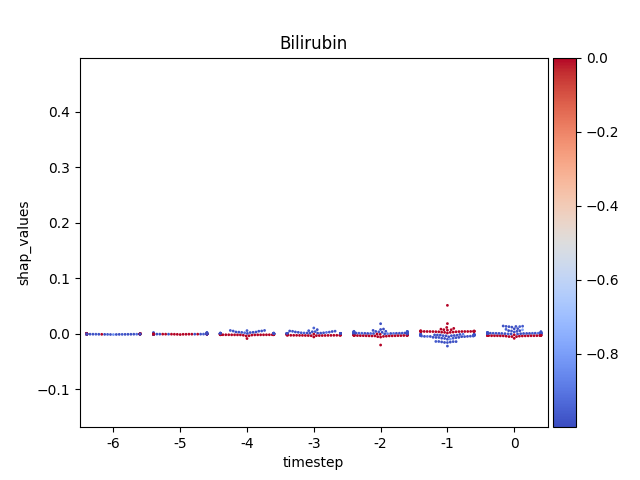
This script demonstrates how to build a custom SHAP visualization
for sequential data using seaborn.swarmplot. This technique
creates a detailed, per-feature view that shows the distribution
of SHAP values at each timestep, offering a high-density
alternative to standard summary plots.
The script’s workflow includes:
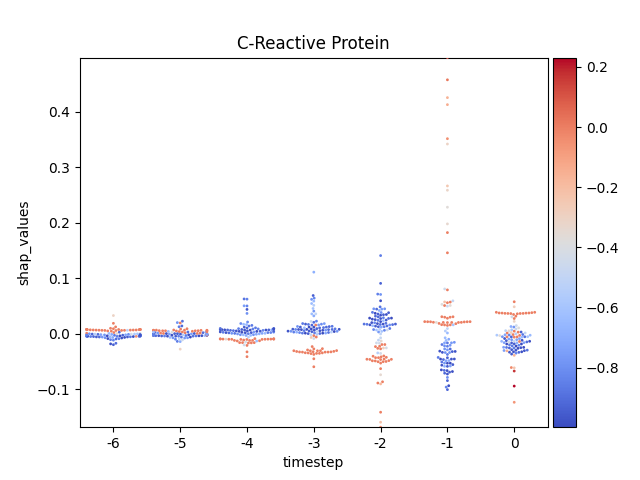
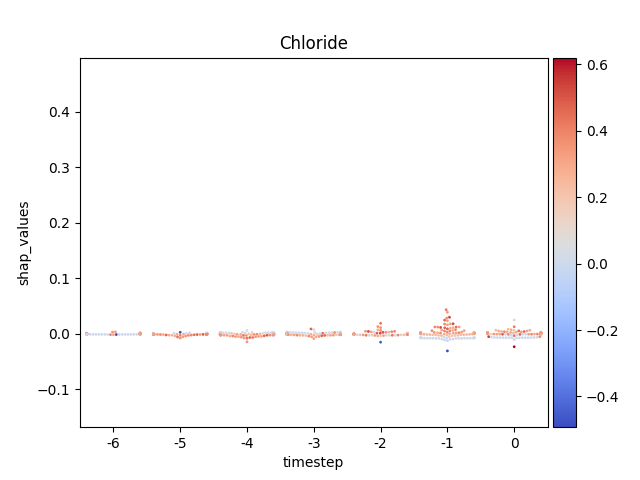
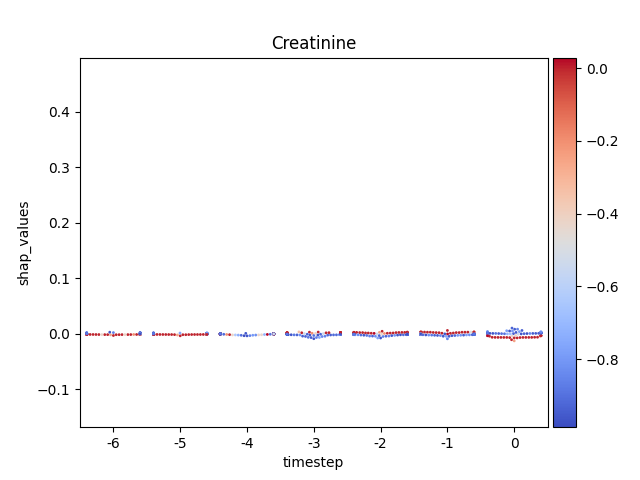
Loading & Subsetting Data: It loads a pre-computed, tidy DataFrame of SHAP values and subsets it to ensure the computationally intensive swarmplot runs efficiently.
Per-Feature Visualization: The script iterates through each feature, generating a separate swarmplot to clearly display its specific impact across the entire time sequence.
Custom Value-Based Coloring: It implements a custom coloring function to tint each point based on its original feature value, adding a color bar to provide the rich context found in native SHAP plots.
Plot Customization: It showcases how to fine-tune the plot’s appearance, including normalizing the y-axis and managing legends for a polished final output.
This example is perfect for users who need to visualize the precise distribution of feature impacts over time, though it is best suited for smaller datasets where the swarmplot can arrange points without significant overlap.
 33 # Libraries
 34 import shap
 35 import numpy as np
 36 import pandas as pd
 37 import seaborn as sns
 38
 39 import matplotlib.pyplot as plt
 40 import matplotlib as mpl
 41 import matplotlib.colorbar
 42 import matplotlib.colors
 43 import matplotlib.cm
 44
 45 from mpl_toolkits.axes_grid1 import make_axes_locatable
 46
 47 try:
 48     __file__
 49     TERMINAL = True
 50 except:
 51     TERMINAL = False
 52
 53
 54 # ------------------------
 55 # Methods
 56 # ------------------------
 57 def scalar_colormap(values, cmap, vmin, vmax):
 58     """This method creates a colormap based on values.
 59
 60     Parameters
 61     ----------
 62     values : array-like
 63     The values to create the corresponding colors
 64
 65     cmap : str
 66     The colormap
 67
 68     vmin, vmax : float
 69     The minimum and maximum possible values
 70
 71     Returns
 72     -------
 73     scalar colormap
 74     """
 75     # Create scalar mappable
 76     norm = mpl.colors.Normalize(vmin=vmin, vmax=vmax, clip=True)
 77     mapper = mpl.cm.ScalarMappable(norm=norm, cmap=cmap)
 78     # Get color map
 79     colormap = sns.color_palette([mapper.to_rgba(i) for i in values])
 80     # Return
 81     return colormap, norm
 82
 83
 84 def scalar_palette(values, cmap, vmin, vmax):
 85     """This method creates a colorpalette based on values.
 86
 87     Parameters
 88     ----------
 89     values : array-like
 90     The values to create the corresponding colors
 91
 92     cmap : str
 93     The colormap
 94
 95     vmin, vmax : float
 96     The minimum and maximum possible values
 97
 98     Returns
 99     -------
100     scalar colormap
101
102     """
103     # Create a matplotlib colormap from name
104     # cmap = sns.light_palette(cmap, reverse=False, as_cmap=True)
105     cmap = sns.color_palette(cmap, as_cmap=True)
106     # Normalize to the range of possible values from df["c"]
107     norm = mpl.colors.Normalize(vmin=vmin, vmax=vmax)
108     # Create a color dictionary (value in c : color from colormap)
109     colors = {}
110     for cval in values:
111         colors.update({cval: cmap(norm(cval))})
112     # Return
113     return colors, norm
114
115 def load_shap_file():
116     """Load shap file.
117
118     .. note: The timestep does not indicate time step but matrix
119              index index. Since the matrix index for time steps
120              started in negative t=-T and ended in t=0 the
121              transformation should be taken into account.
122
123     """
124     from pathlib import Path
125     # Load data
126     path = Path('../../datasets/shap/')
127     data = pd.read_csv(path / 'shap.csv')
128     data = data.iloc[:, 1:]
129     data = data.rename(columns={'timestep': 'indice'})
130     data['timestep'] = data.indice - (data.indice.nunique() - 1)
131     return data
132
133
134
135 # ------------------------------------------------------
136 #                       Main
137 # ------------------------------------------------------
138 # Configuration
139 cmap_name = 'coolwarm' # colormap name
140 norm_shap = True
141
142 # Load data
143 data = load_shap_file()
144
145 # Filter so that it is less computationally expensive
146 data = data[data['sample'] < 100]
147
148 # Show
149 if TERMINAL:
150     print("\nShow:")
151     print(data)
Let’s see how data looks like
155 data.head(10)
Display using sns.swarmplot
Warning
This method seems to be quite slow.
Note
y-axis has been ‘normalized’
166 def add_colorbar(fig, cmap, norm):
167     """"""
168     divider = make_axes_locatable(plt.gca())
169     ax_cb = divider.new_horizontal(size="5%", pad=0.05)
170     fig.add_axes(ax_cb)
171     cb1 = matplotlib.colorbar.ColorbarBase(ax_cb,
172          cmap=cmap, norm=norm, orientation='vertical')
173
174
175 # Loop
176 for i, (name, df) in enumerate(data.groupby('features')):
177
178     # Get colormap
179     values = df.feature_values
180     cmap, norm = scalar_palette(values=values,
181         cmap=cmap_name, vmin=values.min(),
182         vmax=values.max())
183
184     # Display
185     fig, ax = plt.subplots()
186     ax = sns.swarmplot(x='timestep',
187                        y='shap_values',
188                        hue='feature_values',
189                        palette=cmap,
190                        data=df,
191                        size=2,
192                        ax=ax)
193
194     # Format figure
195     plt.title(name)
196     plt.legend([], [], frameon=False)
197
198     if norm_shap:
199         plt.ylim(data.shap_values.min(),
200                  data.shap_values.max())
201
202     # Invert x axis (if no negative timesteps)
203     #ax.invert_xaxis()
204
205     # Create colormap (fix for old versions of mpl)
206     cmap = matplotlib.cm.get_cmap(cmap_name)
207
208     # Add colorbar
209     add_colorbar(plt.gcf(), cmap, norm)
210
211     # Show only first N
212     if int(i) > 5:
213         break
214
215 # Show
216 plt.show()
Out:
C:\Users\kelda\Desktop\repositories\github\python-spare-code\main\examples\shap\plot_main05_swarmplot.py:206: MatplotlibDeprecationWarning:

The get_cmap function was deprecated in Matplotlib 3.7 and will be removed in 3.11. Use ``matplotlib.colormaps[name]`` or ``matplotlib.colormaps.get_cmap()`` or ``pyplot.get_cmap()`` instead.

C:\Users\kelda\Desktop\repositories\virtualenvs\venv-py311-psc\Lib\site-packages\seaborn\categorical.py:3399: UserWarning:

59.0% of the points cannot be placed; you may want to decrease the size of the markers or use stripplot.

C:\Users\kelda\Desktop\repositories\virtualenvs\venv-py311-psc\Lib\site-packages\seaborn\categorical.py:3399: UserWarning:

37.0% of the points cannot be placed; you may want to decrease the size of the markers or use stripplot.

C:\Users\kelda\Desktop\repositories\virtualenvs\venv-py311-psc\Lib\site-packages\seaborn\categorical.py:3399: UserWarning:

53.0% of the points cannot be placed; you may want to decrease the size of the markers or use stripplot.

C:\Users\kelda\Desktop\repositories\virtualenvs\venv-py311-psc\Lib\site-packages\seaborn\categorical.py:3399: UserWarning:

21.0% of the points cannot be placed; you may want to decrease the size of the markers or use stripplot.

C:\Users\kelda\Desktop\repositories\virtualenvs\venv-py311-psc\Lib\site-packages\seaborn\categorical.py:3399: UserWarning:

19.0% of the points cannot be placed; you may want to decrease the size of the markers or use stripplot.

C:\Users\kelda\Desktop\repositories\github\python-spare-code\main\examples\shap\plot_main05_swarmplot.py:206: MatplotlibDeprecationWarning:

The get_cmap function was deprecated in Matplotlib 3.7 and will be removed in 3.11. Use ``matplotlib.colormaps[name]`` or ``matplotlib.colormaps.get_cmap()`` or ``pyplot.get_cmap()`` instead.

C:\Users\kelda\Desktop\repositories\virtualenvs\venv-py311-psc\Lib\site-packages\seaborn\categorical.py:3399: UserWarning:

53.0% of the points cannot be placed; you may want to decrease the size of the markers or use stripplot.

C:\Users\kelda\Desktop\repositories\virtualenvs\venv-py311-psc\Lib\site-packages\seaborn\categorical.py:3399: UserWarning:

49.0% of the points cannot be placed; you may want to decrease the size of the markers or use stripplot.

C:\Users\kelda\Desktop\repositories\virtualenvs\venv-py311-psc\Lib\site-packages\seaborn\categorical.py:3399: UserWarning:

21.0% of the points cannot be placed; you may want to decrease the size of the markers or use stripplot.

C:\Users\kelda\Desktop\repositories\virtualenvs\venv-py311-psc\Lib\site-packages\seaborn\categorical.py:3399: UserWarning:

8.0% of the points cannot be placed; you may want to decrease the size of the markers or use stripplot.

C:\Users\kelda\Desktop\repositories\github\python-spare-code\main\examples\shap\plot_main05_swarmplot.py:206: MatplotlibDeprecationWarning:

The get_cmap function was deprecated in Matplotlib 3.7 and will be removed in 3.11. Use ``matplotlib.colormaps[name]`` or ``matplotlib.colormaps.get_cmap()`` or ``pyplot.get_cmap()`` instead.

C:\Users\kelda\Desktop\repositories\virtualenvs\venv-py311-psc\Lib\site-packages\seaborn\categorical.py:3399: UserWarning:

30.0% of the points cannot be placed; you may want to decrease the size of the markers or use stripplot.

C:\Users\kelda\Desktop\repositories\virtualenvs\venv-py311-psc\Lib\site-packages\seaborn\categorical.py:3399: UserWarning:

34.0% of the points cannot be placed; you may want to decrease the size of the markers or use stripplot.

C:\Users\kelda\Desktop\repositories\virtualenvs\venv-py311-psc\Lib\site-packages\seaborn\categorical.py:3399: UserWarning:

8.0% of the points cannot be placed; you may want to decrease the size of the markers or use stripplot.

C:\Users\kelda\Desktop\repositories\github\python-spare-code\main\examples\shap\plot_main05_swarmplot.py:206: MatplotlibDeprecationWarning:

The get_cmap function was deprecated in Matplotlib 3.7 and will be removed in 3.11. Use ``matplotlib.colormaps[name]`` or ``matplotlib.colormaps.get_cmap()`` or ``pyplot.get_cmap()`` instead.

C:\Users\kelda\Desktop\repositories\virtualenvs\venv-py311-psc\Lib\site-packages\seaborn\categorical.py:3399: UserWarning:

32.0% of the points cannot be placed; you may want to decrease the size of the markers or use stripplot.

C:\Users\kelda\Desktop\repositories\virtualenvs\venv-py311-psc\Lib\site-packages\seaborn\categorical.py:3399: UserWarning:

18.0% of the points cannot be placed; you may want to decrease the size of the markers or use stripplot.

C:\Users\kelda\Desktop\repositories\virtualenvs\venv-py311-psc\Lib\site-packages\seaborn\categorical.py:3399: UserWarning:

8.0% of the points cannot be placed; you may want to decrease the size of the markers or use stripplot.

C:\Users\kelda\Desktop\repositories\virtualenvs\venv-py311-psc\Lib\site-packages\seaborn\categorical.py:3399: UserWarning:

17.0% of the points cannot be placed; you may want to decrease the size of the markers or use stripplot.

C:\Users\kelda\Desktop\repositories\github\python-spare-code\main\examples\shap\plot_main05_swarmplot.py:206: MatplotlibDeprecationWarning:

The get_cmap function was deprecated in Matplotlib 3.7 and will be removed in 3.11. Use ``matplotlib.colormaps[name]`` or ``matplotlib.colormaps.get_cmap()`` or ``pyplot.get_cmap()`` instead.

C:\Users\kelda\Desktop\repositories\virtualenvs\venv-py311-psc\Lib\site-packages\seaborn\categorical.py:3399: UserWarning:

6.0% of the points cannot be placed; you may want to decrease the size of the markers or use stripplot.

C:\Users\kelda\Desktop\repositories\github\python-spare-code\main\examples\shap\plot_main05_swarmplot.py:206: MatplotlibDeprecationWarning:

The get_cmap function was deprecated in Matplotlib 3.7 and will be removed in 3.11. Use ``matplotlib.colormaps[name]`` or ``matplotlib.colormaps.get_cmap()`` or ``pyplot.get_cmap()`` instead.

C:\Users\kelda\Desktop\repositories\github\python-spare-code\main\examples\shap\plot_main05_swarmplot.py:216: UserWarning:

FigureCanvasAgg is non-interactive, and thus cannot be shown
Total running time of the script: ( 0 minutes 11.309 seconds)