Note
Click here to download the full example code
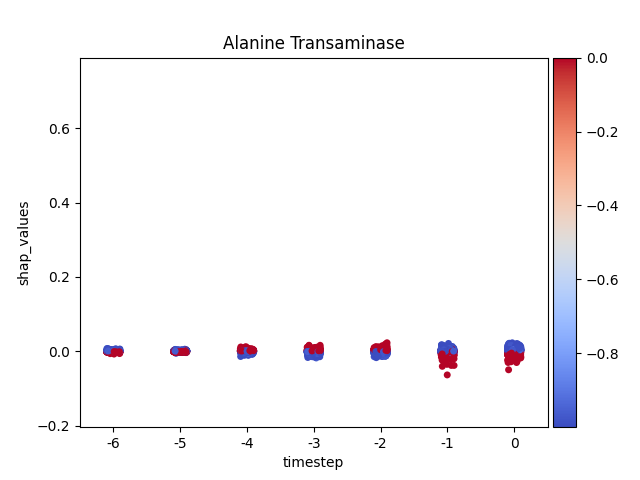
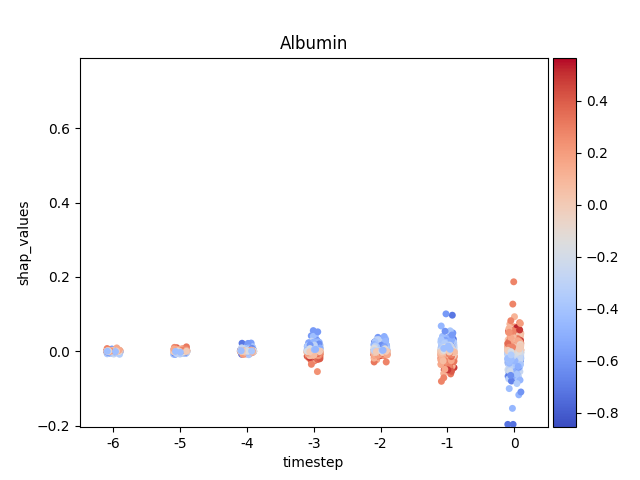
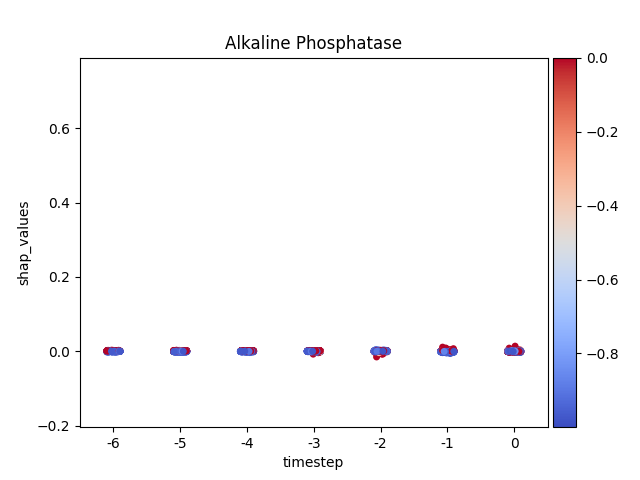
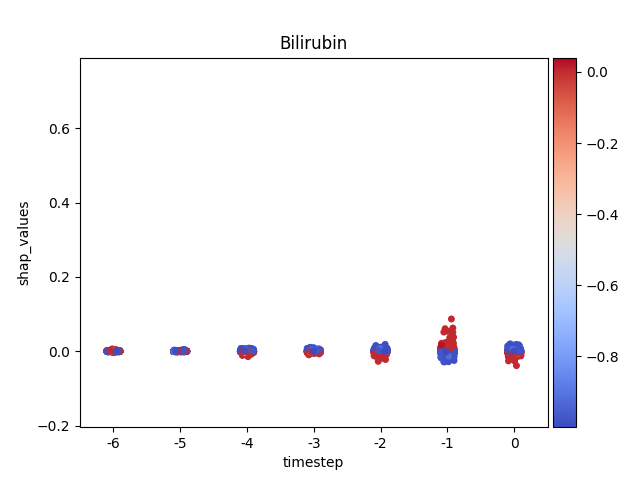
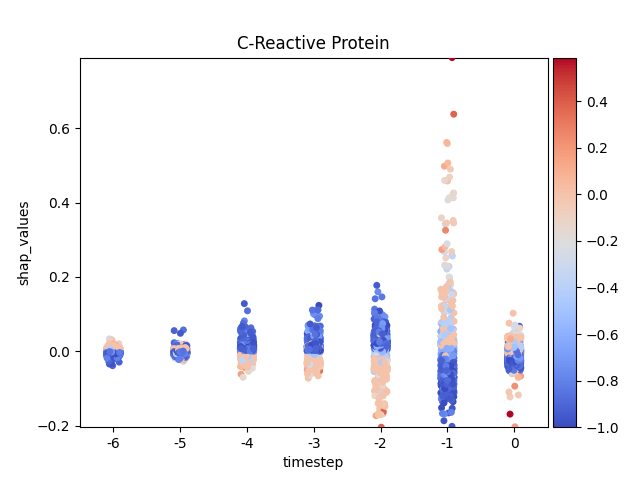
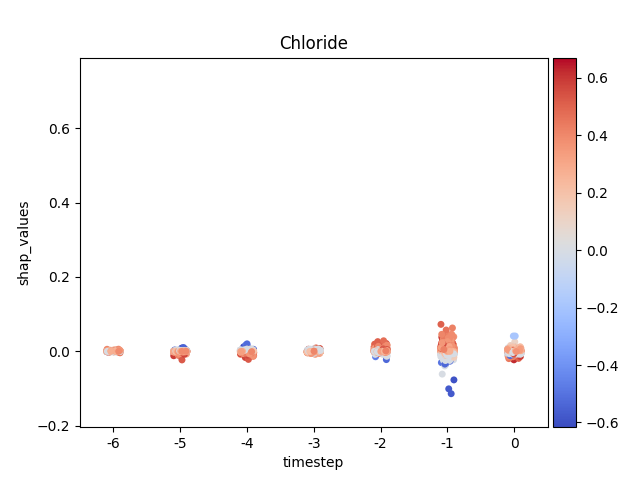
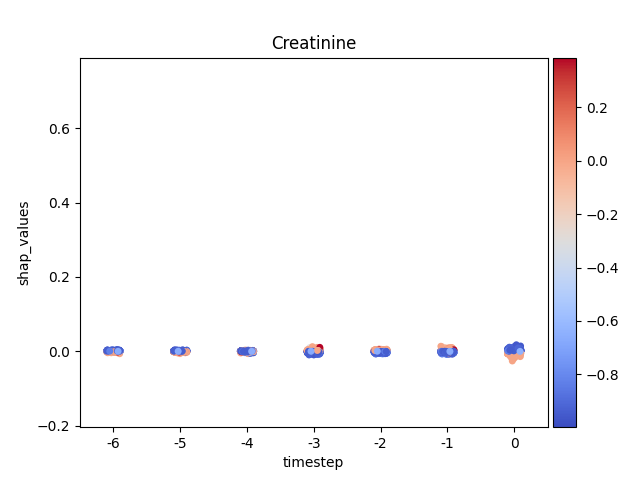
05a. Custom using stripplot
This script demonstrates how to create a custom visualization for
sequential or time-series SHAP values using seaborn.stripplot.
This approach provides a granular, per-feature view of how SHAP
values are distributed across different timesteps, offering an
alternative to the standard SHAP library plots.
The script’s workflow focuses on:
Loading Pre-computed Data: It ingests a tidy DataFrame of SHAP and feature values, structured for time-series analysis.
**Per-Feature Visualization:*8 It iterates through each feature, generating a dedicated stripplot to isolate its impact over time without the influence of other features.
Advanced Coloring: A key feature is the custom implementation of coloring each data point by its original feature value, complete with a color bar, to replicate the rich context provided in native SHAP plots.
8Plot Customization:* It shows how to control axes, legends, and other plot aesthetics for a polished final visualization.
While noted to be slower than other methods, this example is ideal for creating detailed, publication-quality plots that reveal the dynamics of feature contributions over a sequence.
 30 # Libraries
 31 import shap
 32 import numpy as np
 33 import pandas as pd
 34 import seaborn as sns
 35
 36 import matplotlib.pyplot as plt
 37 import matplotlib as mpl
 38 import matplotlib.colorbar
 39 import matplotlib.colors
 40 import matplotlib.cm
 41
 42 from mpl_toolkits.axes_grid1 import make_axes_locatable
 43
 44 try:
 45     __file__
 46     TERMINAL = True
 47 except:
 48     TERMINAL = False
 49
 50
 51 # ------------------------
 52 # Methods
 53 # ------------------------
 54 def scalar_colormap(values, cmap, vmin, vmax):
 55     """This method creates a colormap based on values.
 56
 57     Parameters
 58     ----------
 59     values : array-like
 60     The values to create the corresponding colors
 61
 62     cmap : str
 63     The colormap
 64
 65     vmin, vmax : float
 66     The minimum and maximum possible values
 67
 68     Returns
 69     -------
 70     scalar colormap
 71     """
 72     # Create scalar mappable
 73     norm = mpl.colors.Normalize(vmin=vmin, vmax=vmax, clip=True)
 74     mapper = mpl.cm.ScalarMappable(norm=norm, cmap=cmap)
 75     # Get color map
 76     colormap = sns.color_palette([mapper.to_rgba(i) for i in values])
 77     # Return
 78     return colormap, norm
 79
 80
 81 def scalar_palette(values, cmap, vmin, vmax):
 82     """This method creates a colorpalette based on values.
 83
 84     Parameters
 85     ----------
 86     values : array-like
 87     The values to create the corresponding colors
 88
 89     cmap : str
 90     The colormap
 91
 92     vmin, vmax : float
 93     The minimum and maximum possible values
 94
 95     Returns
 96     -------
 97     scalar colormap
 98
 99     """
100     # Create a matplotlib colormap from name
101     # cmap = sns.light_palette(cmap, reverse=False, as_cmap=True)
102     cmap = sns.color_palette(cmap, as_cmap=True)
103     # Normalize to the range of possible values from df["c"]
104     norm = mpl.colors.Normalize(vmin=vmin, vmax=vmax)
105     # Create a color dictionary (value in c : color from colormap)
106     colors = {}
107     for cval in values:
108         colors.update({cval: cmap(norm(cval))})
109     # Return
110     return colors, norm
111
112
113 def load_shap_file():
114     """Load shap file.
115
116     .. note: The timestep does not indicate time step but matrix
117              index index. Since the matrix index for time steps
118              started in negative t=-T and ended in t=0 the
119              transformation should be taken into account.
120
121     """
122     from pathlib import Path
123     # Load data
124     path = Path('../../datasets/shap/')
125     data = pd.read_csv(path / 'shap.csv')
126     data = data.iloc[:, 1:]
127     data = data.rename(columns={'timestep': 'indice'})
128     data['timestep'] = data.indice - (data.indice.nunique() - 1)
129     return data
130
131
132
133 # -------------------------------------------------------------------
134 #                              Main
135 # -------------------------------------------------------------------
136 # Configuration
137 cmap_name = 'coolwarm' # colormap name
138 norm_shap = True
139
140 # Load data
141 data = load_shap_file()
142 #data = data[data['sample'] < 100]
143
144 # Show
145 if TERMINAL:
146     print("\nShow:")
147     print(data)
Let’s see how data looks like
151 data.head(10)
Let’s show using sns.stripplot
Warning
This method seems to be quite slow.
Note
y-axis has been ‘normalized’
162 def add_colorbar(fig, cmap, norm):
163     """"""
164     divider = make_axes_locatable(plt.gca())
165     ax_cb = divider.new_horizontal(size="5%", pad=0.05)
166     fig.add_axes(ax_cb)
167     cb1 = matplotlib.colorbar.ColorbarBase(ax_cb,
168          cmap=cmap, norm=norm, orientation='vertical')
169
170
171 # Loop
172 for i, (name, df) in enumerate(data.groupby('features')):
173
174     # Get colormap
175     values = df.feature_values
176     cmap, norm = scalar_palette(values=values,
177         cmap=cmap_name, vmin=values.min(),
178         vmax=values.max())
179
180     # Display
181     fig, ax = plt.subplots()
182     ax = sns.stripplot(x='timestep',
183                        y='shap_values',
184                        hue='feature_values',
185                        palette=cmap,
186                        data=df,
187                        ax=ax)
188
189     # Format figure
190     plt.title(name)
191     plt.legend([], [], frameon=False)
192
193     if norm_shap:
194         plt.ylim(data.shap_values.min(),
195                  data.shap_values.max())
196
197     # Invert x axis (if no negative timesteps)
198     #ax.invert_xaxis()
199
200     # Create colormap (fix for old versions of mpl)
201     cmap = matplotlib.cm.get_cmap(cmap_name)
202
203     # Add colorbar
204     add_colorbar(plt.gcf(), cmap, norm)
205
206     # Show only first N
207     if int(i) > 5:
208         break
209
210 # Show
211 plt.show()
Out:
C:\Users\kelda\Desktop\repositories\github\python-spare-code\main\examples\shap\plot_main05_stripplot.py:201: MatplotlibDeprecationWarning:

The get_cmap function was deprecated in Matplotlib 3.7 and will be removed in 3.11. Use ``matplotlib.colormaps[name]`` or ``matplotlib.colormaps.get_cmap()`` or ``pyplot.get_cmap()`` instead.

C:\Users\kelda\Desktop\repositories\github\python-spare-code\main\examples\shap\plot_main05_stripplot.py:211: UserWarning:

FigureCanvasAgg is non-interactive, and thus cannot be shown
Total running time of the script: ( 0 minutes 8.549 seconds)