Note
Go to the end to download the full example code
Stationarity
Example using your package

(4.4, 0.95, {'10%': 1.2888, '5%': 1.1412, '2.5%': 1.0243, '1%': 0.907})

Series:
stationarity-adf_ct_statistic                      -2.58
stationarity-adf_ct_pvalue                        0.2892
stationarity-adf_ct_nlags                              0
stationarity-adf_ct_nobs                              99
stationarity-adf_ct_criticalvalue_1%             -4.0533
stationarity-adf_ct_criticalvalue_5%             -3.4558
stationarity-adf_ct_criticalvalue_10%            -3.1536
stationarity-adf_c_statistic                     -0.8462
stationarity-adf_c_pvalue                         0.8052
stationarity-adf_c_nlags                               1
stationarity-adf_c_nobs                               98
stationarity-adf_c_criticalvalue_1%              -3.4989
stationarity-adf_c_criticalvalue_5%              -2.8915
stationarity-adf_c_criticalvalue_10%             -2.5828
stationarity-kpss_ct_statistic                    0.1709
stationarity-kpss_ct_pvalue                       0.0292
stationarity-kpss_ct_nlags                             5
stationarity-kpss_ct_criticalvalue_10%             0.119
stationarity-kpss_ct_criticalvalue_5%              0.146
stationarity-kpss_ct_criticalvalue_2.5%            0.176
stationarity-kpss_ct_criticalvalue_1%              0.216
stationarity-kpss_c_statistic                     1.5602
stationarity-kpss_c_pvalue                          0.01
stationarity-kpss_c_nlags                              5
stationarity-kpss_c_criticalvalue_10%              0.347
stationarity-kpss_c_criticalvalue_5%               0.463
stationarity-kpss_c_criticalvalue_2.5%             0.574
stationarity-kpss_c_criticalvalue_1%               0.739
stationarity-root_ct_stationary                    False
stationarity-root_c_stationary                     False
stationarity-trend_ct_stationary                   False
stationarity-trend_c_stationary                    False
stationarity-rur_statistic                           4.4
stationarity-rur_pvalue                             0.95
stationarity-rur_criticalvalue_10%                1.2888
stationarity-rur_criticalvalue_5%                 1.1412
stationarity-rur_criticalvalue_2.5%               1.0243
stationarity-rur_criticalvalue_1%                  0.907
stationarity-model                         {'x': [100...
stationarity-id                             Stationarity
dtype: object

Identifier:
Stationarity
(0.9, 0.01, {'10%': 1.2888, '5%': 1.1412, '2.5%': 1.0243, '1%': 0.907})
(9.9, 0.95, {'10%': 1.2888, '5%': 1.1412, '2.5%': 1.0243, '1%': 0.907})
(5.9, 0.95, {'10%': 1.2888, '5%': 1.1412, '2.5%': 1.0243, '1%': 0.907})
(4.4, 0.95, {'10%': 1.2888, '5%': 1.1412, '2.5%': 1.0243, '1%': 0.907})
(2.2, 0.9, {'10%': 1.2888, '5%': 1.1412, '2.5%': 1.0243, '1%': 0.907})
  7 # Libraries
  8 import numpy as np
  9 import pandas as pd
 10 import matplotlib as mpl
 11 import matplotlib.pyplot as plt
 12
 13 # Import pyAMR
 14 from pyamr.datasets.load import make_timeseries
 15 from pyamr.core.stats.stationarity import StationarityWrapper
 16
 17 # ----------------------------
 18 # set basic configuration
 19 # ----------------------------
 20 # Set pandas configuration.
 21 pd.set_option('display.max_colwidth', 14)
 22 pd.set_option('display.width', 150)
 23 pd.set_option('display.precision', 4)
 24
 25 # Set default parameters.
 26 mpl.rc('lines', linewidth=0.35)
 27 mpl.rc('xtick', labelsize=6)
 28 mpl.rc('ytick', labelsize=6)
 29 mpl.rc('legend', fontsize=6)
 30 mpl.rc('grid')
 31 mpl.rc('figure')
 32 mpl.rc('axes')
 33 mpl.rc('font', size=7)
 34
 35 # Font type.
 36 font = {
 37 'family': 'monospace',
 38 'weight': 'normal',
 39 'size': 6,
 40 }
 41
 42 # ----------------------------
 43 # create data
 44 # ----------------------------
 45 # Constants
 46 length = 100
 47 offset = 100
 48 slope = 4
 49
 50 # Create variables.
 51 x = np.arange(length)
 52 n = np.random.rand(length)
 53
 54 # Create timeseries.
 55 y_n = n
 56 y_c = np.ones(length)*offset
 57 y_t = x*slope+n
 58 y_ct = x*slope+offset+n*20
 59 y_r = np.concatenate((y_ct[:50], y_ct[50:]-offset))
 60 x_s, y_s, f_s = make_timeseries()
 61
 62 # ----------------------------
 63 # Example of stationarity
 64 # ----------------------------
 65 # Single example
 66 stationarity = StationarityWrapper()\
 67     .fit(y_r, adf_kwargs={}, kpss_kwargs={})
 68
 69 # Show
 70 print("\nSeries:")
 71 print(stationarity.as_series())
 72
 73 print("\nIdentifier:")
 74 print(stationarity._identifier())
 75
 76
 77 # ---------------------------
 78 # Plot
 79 # ---------------------------
 80 # .. note:: Including in the timeseries variable the value
 81 #           y_c produces the following error:
 82 #           ValueError: cannot convert float NaN to integer.
 83
 84 # Create array of time series
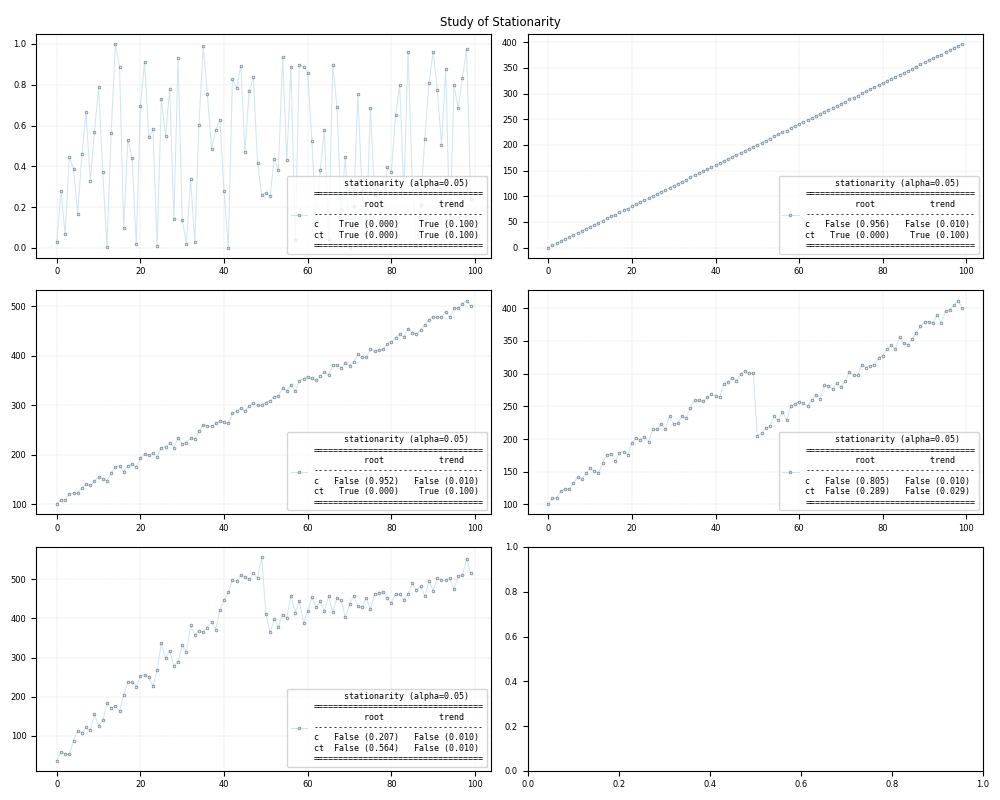
 85 timeseries = [y_n, y_c, y_t, y_ct, y_r, y_s]
 86 timeseries = [y_n, y_t, y_ct, y_r, y_s]
 87
 88 # Create figure
 89 fig, axes = plt.subplots(3,2, figsize=(10,8))
 90 axes = axes.flatten()
 91
 92 # Loop
 93 for i,ts in enumerate(timeseries):
 94     #print("Stationarity... %s" % i)
 95
 96     # Create stationarity wrapper.
 97     stationarity = StationarityWrapper().fit(x=ts)
 98
 99     # Plot
100     axes[i].plot(ts, color='#A6CEE3', alpha=0.5, marker='o',
101                  markeredgecolor='k', markeredgewidth=0.5,
102                  markersize=2, linewidth=0.75,
103                  label=stationarity.as_summary())
104
105     # Set grid
106     axes[i].grid(color='gray', linestyle='--',
107                  linewidth=0.2, alpha=0.5)
108
109     # Set legend
110     axes[i].legend(prop=font, loc=4)
111
112 # Study of Stationarity
113 plt.suptitle("Study of Stationarity")
114 plt.tight_layout()
115
116 # Show
117 plt.show()
Total running time of the script: ( 0 minutes 0.505 seconds)