Note
Go to the end to download the full example code
Using weighted least squares (WLS)
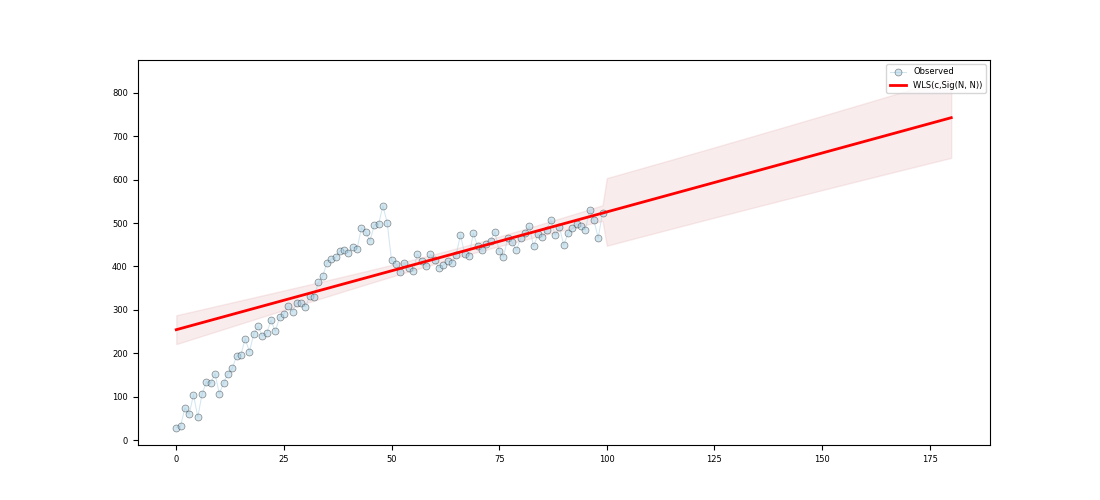
Approximating a function using Weighted Least Squares (WLS)

c:\users\kelda\desktop\repositories\virtualenvs\venv-py391-pyamr\lib\site-packages\statsmodels\regression\linear_model.py:807: RuntimeWarning:

divide by zero encountered in log


Series:
wls-rsquared                  0.5779
wls-rsquared_adj              0.5736
wls-fvalue                  134.1544
wls-fprob                        0.0
wls-aic                          inf
wls-bic                          inf
wls-llf                         -inf
wls-mse_model            195292.0736
wls-mse_resid              1455.7267
wls-mse_total              3413.6696
wls-const_coef              254.2846
wls-const_std                16.7907
wls-const_tvalue             15.1444
wls-const_tprob                  0.0
wls-const_cil                220.964
wls-const_ciu               287.6052
wls-x1_coef                   2.7125
wls-x1_std                    0.2342
wls-x1_tvalue                11.5825
wls-x1_tprob                     0.0
wls-x1_cil                    2.2478
wls-x1_ciu                    3.1773
wls-s_dw                       0.421
wls-s_jb_value                 3.943
wls-s_jb_prob                  0.139
wls-s_skew                     0.315
wls-s_kurtosis                  3.74
wls-s_omnibus_value            4.322
wls-s_omnibus_prob             0.115
wls-m_dw                      0.1172
wls-m_jb_value                8.1659
wls-m_jb_prob                 0.0169
wls-m_skew                    -0.622
wls-m_kurtosis                3.6422
wls-m_nm_value                8.4851
wls-m_nm_prob                 0.0144
wls-m_ks_value                0.6487
wls-m_ks_prob                    0.0
wls-m_shp_value               0.9342
wls-m_shp_prob                0.0001
wls-m_ad_value                2.9263
wls-m_ad_nnorm                 False
wls-missing                    raise
wls-exog               [[1.0, 0.0...
wls-endog              [29.062339...
wls-trend                          c
wls-weights            [0.0887244...
wls-W                  <pyamr.met...
wls-model              <statsmode...
wls-id                 WLS(c,Sig(...
dtype: object

Regression line:
[254.28 257.   259.71 262.42 265.13 267.85 270.56 273.27 275.98 278.7 ]

Summary:
                            WLS Regression Results
==============================================================================
Dep. Variable:                      y   R-squared:                       0.578
Model:                            WLS   Adj. R-squared:                  0.574
Method:                 Least Squares   F-statistic:                     134.2
Date:                Thu, 15 Jun 2023   Prob (F-statistic):           4.66e-20
Time:                        18:15:48   Log-Likelihood:                   -inf
No. Observations:                 100   AIC:                               inf
Df Residuals:                      98   BIC:                               inf
Df Model:                           1
Covariance Type:            nonrobust
==============================================================================
                 coef    std err          t      P>|t|      [0.025      0.975]
------------------------------------------------------------------------------
const        254.2846     16.791     15.144      0.000     220.964     287.605
x1             2.7125      0.234     11.583      0.000       2.248       3.177
==============================================================================
Omnibus:                        4.322   Durbin-Watson:                   0.421
Prob(Omnibus):                  0.115   Jarque-Bera (JB):                3.943
Skew:                           0.315   Prob(JB):                        0.139
Kurtosis:                       3.740   Cond. No.                         221.
Normal (N):                     8.485   Prob(N):                         0.014
==============================================================================
  9 # Import class.
 10 import sys
 11 import numpy as np
 12 import pandas as pd
 13 import matplotlib as mpl
 14 import matplotlib.pyplot as plt
 15 import statsmodels.api as sm
 16 import statsmodels.robust.norms as norms
 17
 18 # import weights.
 19 from pyamr.datasets.load import make_timeseries
 20 from pyamr.core.regression.wls import WLSWrapper
 21 from pyamr.metrics.weights import SigmoidA
 22
 23 # ----------------------------
 24 # set basic configuration
 25 # ----------------------------
 26 # Matplotlib options
 27 mpl.rc('legend', fontsize=6)
 28 mpl.rc('xtick', labelsize=6)
 29 mpl.rc('ytick', labelsize=6)
 30
 31 # Set pandas configuration.
 32 pd.set_option('display.max_colwidth', 14)
 33 pd.set_option('display.width', 150)
 34 pd.set_option('display.precision', 4)
 35
 36 # ----------------------------
 37 # create data
 38 # ----------------------------
 39 # Create timeseries data
 40 x, y, f = make_timeseries()
 41
 42 # Create method to compute weights from frequencies
 43 W = SigmoidA(r=200, g=0.5, offset=0.0, scale=1.0)
 44
 45 # Note that the function fit will call M.weights(weights) inside and will
 46 # store the M converter in the instance. Therefore, the code execute is
 47 # equivalent to <weights=M.weights(f)> with the only difference being that
 48 # the weight converter is not saved.
 49 wls = WLSWrapper(estimator=sm.WLS).fit( \
 50     exog=x, endog=y, trend='c', weights=f,
 51     W=W, missing='raise')
 52
 53 # Print series.
 54 print("\nSeries:")
 55 print(wls.as_series())
 56
 57 # Print regression line.
 58 print("\nRegression line:")
 59 print(wls.line(np.arange(10)))
 60
 61 # Print summary.
 62 print("\nSummary:")
 63 print(wls.as_summary())
 64
 65 # -----------------
 66 # Save & Load
 67 # -----------------
 68 # File location
 69 #fname = '../../examples/saved/wls-sample.pickle'
 70
 71 # Save
 72 #wls.save(fname=fname)
 73
 74 # Load
 75 #wls = WLSWrapper().load(fname=fname)
 76
 77 # -------------
 78 #  Example I
 79 # -------------
 80 # This example shows how to make predictions using the wrapper and how
 81 # to plot the resultin data. In addition, it compares the intervales
 82 # provided by get_prediction (confidence intervals) and the intervals
 83 # provided by wls_prediction_std (prediction intervals).
 84 #
 85 # To Do: Implement methods to compute CI and PI (see regression).
 86
 87 # Variables.
 88 start, end = None, 180
 89
 90 # Compute predictions (exogenous?). It returns a 2D array
 91 # where the rows contain the time (t), the mean, the lower
 92 # and upper confidence (or prediction?) interval.
 93 preds = wls.get_prediction(start=start, end=end)
 94
 95
 96 # Create figure
 97 fig, ax = plt.subplots(1, 1, figsize=(11,5))
 98
 99 # Plotting confidence intervals
100 # -----------------------------
101 # Plot truth values.
102 ax.plot(x, y, color='#A6CEE3', alpha=0.5, marker='o',
103               markeredgecolor='k', markeredgewidth=0.5,
104               markersize=5, linewidth=0.75, label='Observed')
105
106 # Plot forecasted values.
107 ax.plot(preds[0,:], preds[1, :], color='#FF0000', alpha=1.00,
108                 linewidth=2.0, label=wls._identifier(short=True))
109
110 # Plot the confidence intervals.
111 ax.fill_between(preds[0, :],
112                 preds[2, :],
113                 preds[3, :],
114                 color='r',
115                 alpha=0.1)
116
117 # Legend
118 plt.legend()
119
120 # Show
121 plt.show()
Total running time of the script: ( 0 minutes 0.111 seconds)