Note
Go to the end to download the full example code
Using Theil-Sen estimator
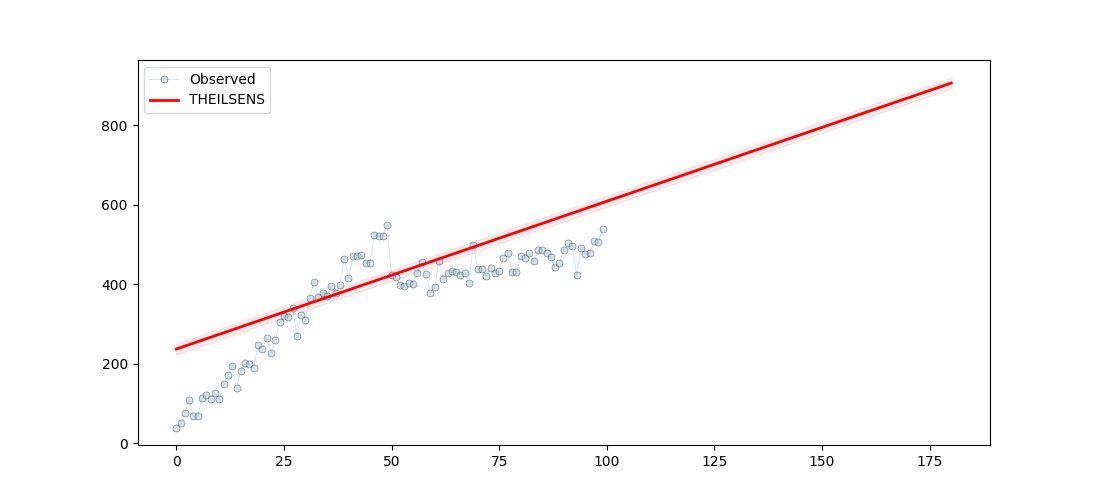
In non-parametric statistics, the Theil–Sen estimator is a method for robustly fitting a line to sample points in the plane (simple linear regression) by choosing the median of the slopes of all lines through pairs of points.
14 # Libraries
15 import numpy as np
16 import pandas as pd
17
18 # Libraries.
19 import matplotlib.pyplot as plt
20
21 # Import pyamr
22 from pyamr.datasets.load import make_timeseries
23 from pyamr.core.regression.theilsens import TheilSensWrapper
24
25 # Set pandas configuration.
26 pd.set_option('display.max_colwidth', 14)
27 pd.set_option('display.width', 150)
28 pd.set_option('display.precision', 4)
29
30 def make_line(length, offset, slope):
31     """Create straight series."""
32     # Create timeseries.
33     x = np.arange(length)
34     y = np.random.rand(length) * slope + offset + x
35     return x, y
36
37 # ----------------------------
38 # create data
39 # ----------------------------
40 # Constants
41 length = 100
42 offset = 100
43 slope = 10
44
45 # Create series
46 #x, y = make_line(length, offset, slope)
47
48 # Create timeseries data
49 x, y, f = make_timeseries()
50
51 # Create object
52 theilsens = TheilSensWrapper().fit(x=x, y=y)
53
54 # Print series.
55 print("\nSeries:")
56 print(theilsens.as_series())
57
58 # Print summary.
59 print("\nSummary:")
60 print(theilsens.as_summary())
Series:
theilsens-slope               3.7184
theilsens-intercept         237.4303
theilsens-ci_lower            3.0622
theilsens-ci_upper            4.3009
theilsens-x            [0, 1, 2, ...
theilsens-y            [40.118153...
theilsens-model        (3.7183711...
theilsens-id               THEILSENS
dtype: object

Summary:
         TheilSens Slope
==================================
slope:                      3.7184
intercept:                237.4303
ci_lower:                   3.0622
ci_upper:                   4.3009
==================================
Lets visualise the predictions
65 # -----------------
66 #  Predictions
67 # -----------------
68 # Variables.
69 start, end, = None, 180
70
71 # Compute predictions.
72 preds = theilsens.get_prediction(start=start, end=end)
73
74 # Create figure
75 fig, ax = plt.subplots(1, 1, figsize=(11,5))
76
77 # Plot truth values.
78 ax.plot(x, y, color='#A6CEE3', alpha=0.5, marker='o',
79          markeredgecolor='k', markeredgewidth=0.5,
80          markersize=5, linewidth=0.75, label='Observed')
81
82 # Plot forecasted values.
83 ax.plot(preds[0, :], preds[1, :], color='#FF0000', alpha=1.00,
84          linewidth=2.0, label=theilsens._identifier())
85
86 # Plot the confidence intervals.
87 ax.fill_between(preds[0, :],
88                 preds[2, :],
89                 preds[3, :],
90                 color='r',
91                 alpha=0.1)
92
93 # Legend
94 plt.legend()
95
96 # Show
97 plt.show()

Let’s perform Grid Search
102 # ----------
103 # Grid search
104 # -----------
105 # Grid parameters.
106 grid_params = {'x': [x], 'y': [y], 'alpha': [0.05, 0.1]}
107
108 # Get summary.
109 summary = TheilSensWrapper().grid_search_dataframe(grid_params=grid_params)
110
111 # Plot result
112 #print("Grid Search:")
113 #print(summary)
117 summary
Total running time of the script: ( 0 minutes 0.088 seconds)