Note
Click here to download the full example code
Sample 02
This examples computes the three most basic standard SQIs (kurtosis, skewness and entropy). In addition, it shows the code and explains it in different sections. This is similar to jupyter notebook. It is just an example.
Warning
The dtw module seems to be loaded even though
we are not really using it. Instead, load it
only when required.
Main
First, lets import the required libraries
25 26 27 28 29 30 31 32 33 34 | # Libraries generic
import numpy as np
import pandas as pd
# Libraries specific
from vital_sqi.sqi.standard_sqi import perfusion_sqi
from vital_sqi.sqi.standard_sqi import kurtosis_sqi
from vital_sqi.sqi.standard_sqi import skewness_sqi
from vital_sqi.sqi.standard_sqi import entropy_sqi
from vital_sqi.sqi.standard_sqi import signal_to_noise_sqi
|
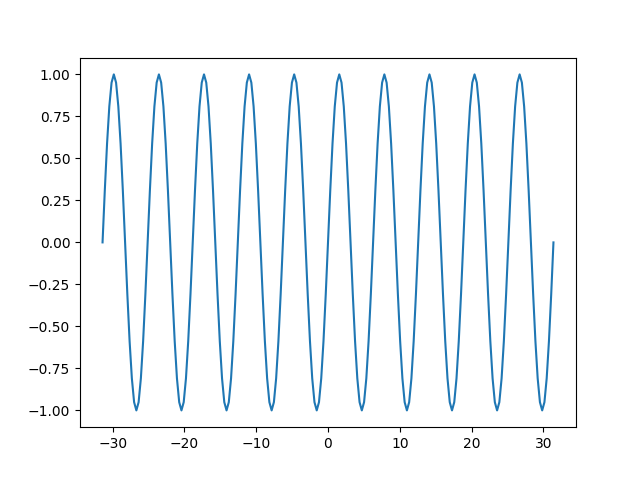
Lets create the sinusoide
40 41 42 43 44 | # Create samples
x = np.linspace(-10*np.pi, 10*np.pi, 201)
# Create signal
signal = np.sin(x)
|
Lets compute the SQIs
50 51 52 53 | # Loop computing sqis
k = kurtosis_sqi(signal)
s = skewness_sqi(signal)
e = entropy_sqi(signal)
|
Lets display the result
59 60 61 62 63 64 65 66 67 | # Create Series
result = pd.Series(
data=[k, s, e],
index=['kurtosis', 'skewness', 'entropy']
)
# Show
print("\nResult:")
print(result)
|
Out:
Result:
kurtosis   -1.492500e+00
skewness   -1.605493e-16
entropy     4.997679e+00
dtype: float64
Plot
Lets plot something so it shows a thumbicon
76 77 78 79 80 81 82 83 84 85 86 | # ---------------
# Create plot
# ---------------
# Library
import matplotlib.pyplot as plt
# Plot
plt.plot(x, signal)
# Show
plt.show()
|

Total running time of the script: ( 0 minutes 0.062 seconds)