Note
Click here to download the full example code
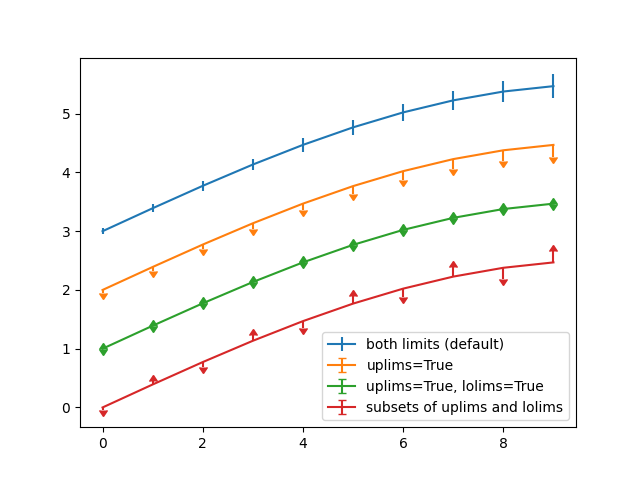
12a. Matplotlib to Plotly (errorbar)
This example converts a matplotlib figure to Plotly.
Warning
A known bug in Plotly (see GitHub issue) causes the mpl_to_plotly() function to fail because it references an outdated function from Matplotlib. The current fix is to downgrade to an older version of Matplotlib or to recreate your figure in Plotly manually.
[ISSUE]: https://github.com/plotly/plotly.py/issues/3624#issuecomment-1161805210 In the latest commit of plotly packages/python/plotly/plotly/matplotlylib/mpltools.py line 368, it still calls is_frame_like() function.
Out:
'\n.. note:: This section has been commented as it does not work\n with recent versions of matplotlib. Downgrade an\n remove quotes to run it.\n \n# Convert to plotly\nimport plotly.tools as tls\n\n# Convert to plotly\nfig = tls.mpl_to_plotly(fig)\n\nprint(fig.data)\n\n# Show\n#fig.show()\nfig\n'
18 # Libraries
19 import numpy as np
20 import matplotlib.pyplot as plt
21
22 try:
23     __file__
24     TERMINAL = True
25 except:
26     TERMINAL = False
27
28
29 # Create data
30 x = np.arange(10)
31 y = 2.5 * np.sin(x / 20 * np.pi)
32 yerr = np.linspace(0.05, 0.2, 10)
33
34 # Figure
35 fig = plt.figure()
36 plt.errorbar(x, y + 3, yerr=yerr, label='both limits (default)')
37 plt.errorbar(x, y + 2, yerr=yerr, uplims=True, label='uplims=True')
38 plt.errorbar(x, y + 1, yerr=yerr, uplims=True, lolims=True,
39              label='uplims=True, lolims=True')
40
41 # Add error
42 upperlimits = [True, False] * 5
43 lowerlimits = [False, True] * 5
44 plt.errorbar(x, y, yerr=yerr, uplims=upperlimits, lolims=lowerlimits,
45              label='subsets of uplims and lolims')
46
47 # add legent
48 plt.legend(loc='lower right')
49
50
51 """
52 .. note:: This section has been commented as it does not work
53           with recent versions of matplotlib. Downgrade an
54           remove quotes to run it.
55
56 # Convert to plotly
57 import plotly.tools as tls
58
59 # Convert to plotly
60 fig = tls.mpl_to_plotly(fig)
61
62 print(fig.data)
63
64 # Show
65 #fig.show()
66 fig
67 """
Total running time of the script: ( 0 minutes 0.078 seconds)