Note
Click here to download the full example code
06. Threshold moving approaches
Out:
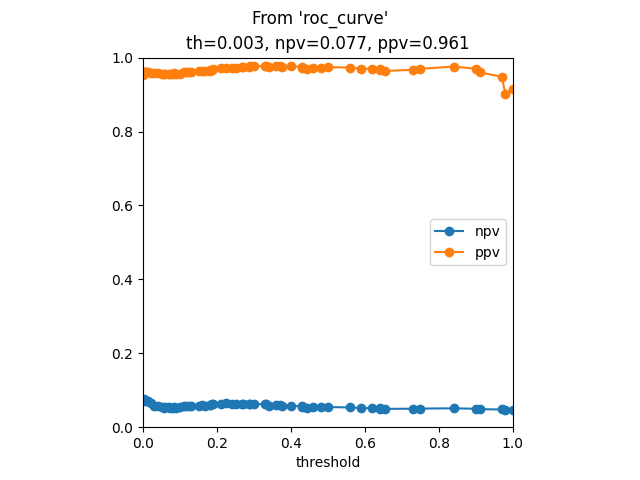
Results from 'roc_curve'
       th       ppv       npv      sens      spec     gmean
69  0.000  0.951872       NaN  1.000000  0.000000  0.000000
68  0.010  0.961945  0.085375  0.795455  0.377622  0.256511
67  0.015  0.962139  0.081454  0.772727  0.398601  0.296193
66  0.020  0.963411  0.085375  0.772727  0.419580  0.295118
65  0.030  0.963836  0.086675  0.772727  0.426573  0.292956
..    ...       ...       ...       ...       ...       ...
4   0.970  0.969824  0.049887  0.090909  0.944056  0.574130
3   0.980  0.977196  0.050589  0.090909  0.958042  0.569404
2   0.990  0.980924  0.050939  0.090909  0.965035  0.554987
1   1.000  0.974726  0.049759  0.068182  0.965035  0.548071
0     inf       NaN  0.048128  0.000000  1.000000  0.000000

[70 rows x 6 columns]


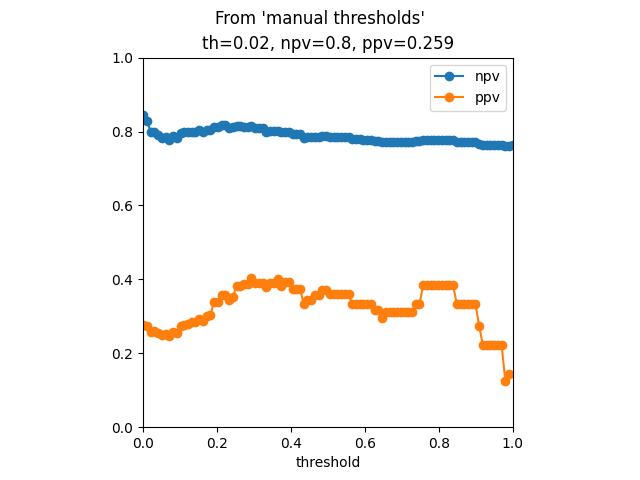
Results from manual
          th       ppv       npv      sens      spec
0   0.000000  0.282258  0.857143  0.795455  0.377622
1   0.010101  0.283333  0.850746  0.772727  0.398601
2   0.020202  0.293103  0.859155  0.772727  0.426573
3   0.030303  0.303571  0.866667  0.772727  0.454545
4   0.040404  0.305556  0.860759  0.750000  0.475524
..       ...       ...       ...       ...       ...
95  0.959596  0.333333  0.771429  0.090909  0.944056
96  0.969697  0.333333  0.771429  0.090909  0.944056
97  0.979798  0.400000  0.774011  0.090909  0.958042
98  0.989899  0.444444  0.775281  0.090909  0.965035
99  1.000000       NaN  0.764706  0.000000  1.000000

[100 rows x 5 columns]
  8 # Libraries
  9 import numpy as np
 10 import pandas as pd
 11 import matplotlib.pyplot as plt
 12
 13 # Libraries scikits
 14 from sklearn.datasets import fetch_openml
 15 from sklearn.datasets import load_iris
 16 from sklearn.datasets import load_breast_cancer
 17 from sklearn.preprocessing import StandardScaler
 18 from sklearn.pipeline import make_pipeline
 19 from sklearn.linear_model import LogisticRegression
 20 from sklearn.ensemble import ExtraTreesClassifier
 21 from sklearn.model_selection import train_test_split
 22
 23
 24 def display_npv_ppv_curve(ppv, npv, ths, idx):
 25     """This method plots the curve
 26
 27     Parameters
 28     ----------
 29     ppv: array-like
 30     npv: array-like
 31     ths: array-like
 32     idx: integer
 33     """
 34     # Display
 35     f, axes = plt.subplots(1, 1)
 36     axes.plot(ths, npv, marker='o', label='npv')
 37     axes.plot(ths, ppv, marker='o', label='ppv')
 38     axes.set(aspect='equal', xlim=[0,1], ylim=[0,1],
 39         xlabel='threshold', title='th={0}, npv={1}, ppv={2}' \
 40             .format(round(ths[idx], 3),
 41                     round(npv[idx], 3),
 42                     round(ppv[idx], 3)))
 43     plt.legend()
 44
 45
 46 def npv_ppv_from_sens_spec(sens, spec, prev):
 47     """Compute npv and ppv.
 48
 49     Parameters
 50     ----------
 51     sens: array-like
 52     spec: array-like
 53     prev: float
 54     """
 55     npv = (spec * (1 - prev)) / ((spec * (1 - prev)) + ((1 - sens) * prev))
 56     ppv = (sens * prev) / ((sens * prev) + ((1 - spec) * (1 - prev)))
 57     return npv, ppv
 58
 59
 60
 61 # ----------------------
 62 # Load data
 63 # ----------------------
 64 # Fetch data
 65 X, y = fetch_openml(data_id=1464,
 66                     return_X_y=True,
 67                     as_frame=True)
 68                     #parser='auto')
 69
 70 # Format y to binary (0,1)
 71 y = y.cat.rename_categories({'1':0, '2':1})
 72
 73
 74 # Split
 75 X_train, X_test, y_train, y_test = \
 76     train_test_split(X, y, stratify=y)
 77
 78 # ----------------------
 79 # Create pipeline
 80 # ----------------------
 81 # Create pipeline
 82 clf = make_pipeline(
 83     StandardScaler(),
 84     #LogisticRegression(random_state=0)
 85     ExtraTreesClassifier(n_estimators=100)
 86 )
 87
 88 # Train
 89 clf.fit(X_train, y_train)
 90
 91 # Predictions
 92 y_pred = clf.predict(X_test)
 93 y_prob = clf.predict_proba(X_test)
 94
 95 # .. note: Some classifiers do not have the decision
 96 #          function method but all implement the
 97 #          predict_proba.
 98 #y_score = clf.decision_function(X_test)
 99
100 # -----------------------
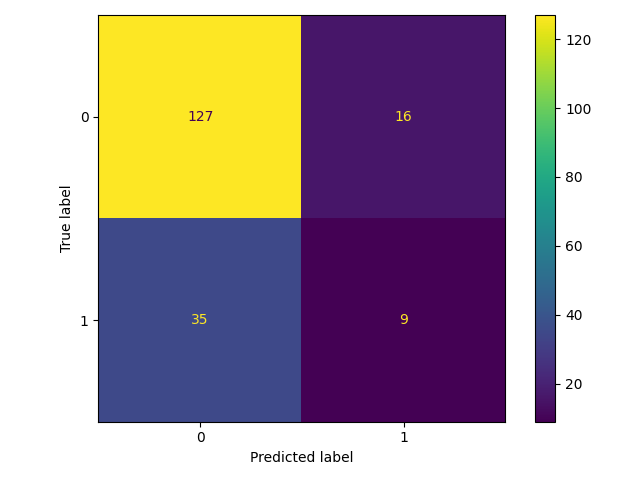
101 # Show confusion matrix
102 # -----------------------
103 # .. note: We are using Display objects to plot
104 #          the graphs, they could also be displayed
105 #          using the functions or matplotlib
106 #          directly.
107 #
108 # plot_roc_curve(clf, X_test, y_test, ax=ax_roc, name=name)
109 # plot_det_curve(clf, X_test, y_test, ax=ax_roc, name=name)
110
111 # Libraries
112 from sklearn.metrics import confusion_matrix
113 from sklearn.metrics import ConfusionMatrixDisplay
114 from sklearn.metrics import roc_curve
115 from sklearn.metrics import RocCurveDisplay
116 from sklearn.metrics import precision_recall_curve
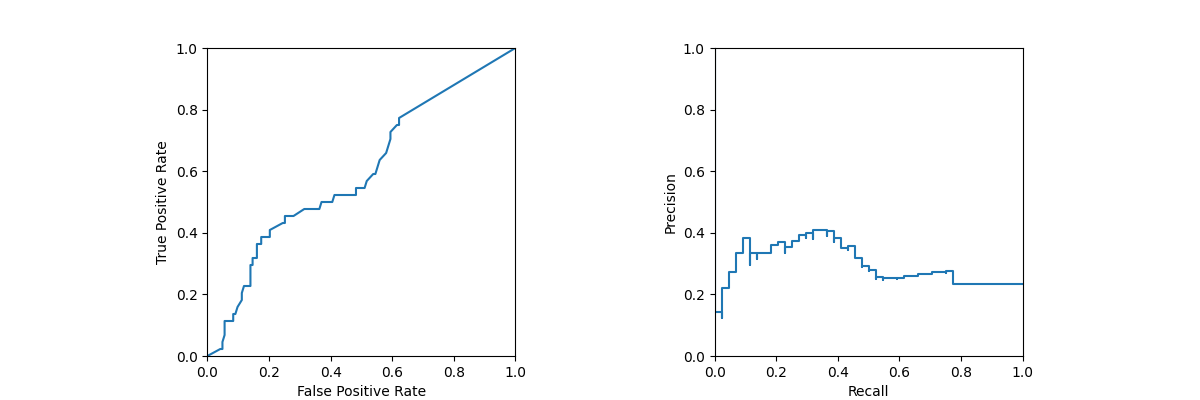
117 from sklearn.metrics import PrecisionRecallDisplay
118
119 # Value counts
120 value_counts = y.value_counts()
121
122 # Prevalence
123 prev = value_counts[1] / len(y_test)
124
125 # Confusion matrix
126 cm = confusion_matrix(y_test, y_pred)
127
128 # .. note: It is possible to use either y_score
129 #          or y_prob in the roc_curve function
130 # .. note: sens=tpr, spec=1-fpr
131 # Compute ROC curve
132 fpr, tpr, ths1 = roc_curve(
133     y_test, y_prob[:, 1],
134     drop_intermediate=False)
135
136 # .. note: ppv=prec, sens=recall
137 # Compute PR curve
138 prec, recall, ths2 = \
139     precision_recall_curve(y_test, y_prob[:, 1])
140
141 # Create plot objects
142 cm_display = ConfusionMatrixDisplay(cm)
143 roc_display = RocCurveDisplay(fpr=fpr, tpr=tpr)
144 pr_display = PrecisionRecallDisplay(precision=prec, recall=recall)
145
146 # Create figure
147 f, axes = plt.subplots(1, 2, figsize=(12, 4))
148 axes = axes.flatten()
149
150 # Display
151 cm_display.plot()
152 roc_display.plot(ax=axes[0])
153 pr_display.plot(ax=axes[1])
154
155 # Configure
156 for ax in axes:
157     ax.set(aspect='equal', xlim=[0,1], ylim=[0,1])
158 plt.tight_layout()
159
160
161
162 # ---------
163 # Option I
164 # ---------
165 # Compute the npv and ppv from the sensitivity
166 # and specificity values obtained from the
167 # 'roc_curve' function.
168
169 # Compute ROC curve
170 fpr, tpr, ths1 = roc_curve(
171     y_test, y_prob[:, 1],
172     drop_intermediate=False)
173
174 # Compute npv and ppv
175 npv, ppv = npv_ppv_from_sens_spec( \
176     sens=tpr, spec=1-fpr, prev=prev)
177
178 # Create DataFrame
179 results = pd.DataFrame(
180     data=np.array([ths1, ppv, npv, tpr, 1-fpr]).T,
181     columns=['th', 'ppv', 'npv', 'sens', 'spec']
182 ).sort_values(by='th')
183
184 # Add gmean
185 results['gmean'] = np.sqrt(tpr * (1-fpr))
186
187 # Find closest to 0.8
188 idx = np.nanargmin(np.abs(npv - 0.8))
189
190 # Find best gmean
191 idx2 = np.argmax(results.gmean)
192
193 # Display
194 display_npv_ppv_curve(ppv, npv, ths1, idx)
195
196 # Title
197 plt.suptitle("From 'roc_curve'")
198
199 # Show
200 print("\n\nResults from 'roc_curve'")
201 print(results)
202
203 """
204 # ---------
205 # Option II
206 # ---------
207 # NOT WORKING!
208 #
209 # Compute the npv by knowing that it is the inverse
210 # of the precision, thus calling the function
211 # 'precision_recall_curve' with opposite labels and
212 # probabilities.
213
214 # .. note: invprec=npv
215 # .. note: invrec=fnr
216 # Computed inverted PR curve
217 invprec, invrec, invths2 = \
218     precision_recall_curve(y_test, y_prob[:, 0],
219         pos_label=clf.classes_[0])
220
221 # Create DataFrame
222 results = pd.DataFrame()
223 results['th'] = invths2[::-1]
224 results['npv'] = invprec[1:]
225 results['ppv'] = 0.0
226 results = results.sort_values(by='th')
227
228 # Find closest to 0.8
229 idx = np.nanargmin(np.abs(invprec - 0.8))
230
231 # Show
232 print("\n\nResults from 'precision_recall_curve'")
233 print(results)
234 print("\nIndex: {0} | Threshold: {1} | NPV: {2}" \
235     .format(idx, invths2[idx-1], npv[idx]))
236
237 # Display graph
238 display_npv_ppv_curve(
239     results.ppv,
240     results.npv,
241     results.th,
242     idx)
243
244 # Title
245 plt.suptitle("From 'precision_recall_curve'")
246 """
247
248 # ----------
249 # Option II
250 # ----------
251 # Perform the computation of metrics and the threshold
252 # search based on a condition (e.g. npv closest to an
253 # specific value) manually.
254 # Thresholds
255 thresholds = np.linspace(0,1,100)
256
257 # Metrics
258 def metrics(y_test, y_prob, th, **kwargs):
259     # Libraries
260     from sklearn.metrics import confusion_matrix
261     # Compute confusion matrix
262     cm = confusion_matrix(y_test, y_prob>th)
263     tn, fp, fn, tp = cm.ravel()
264     # Compute metrics
265     return {'th': th,
266             'ppv': tp/(tp+fp),
267             'npv': tn/(tn+fn),
268             'sens': tp/(tp+fn),
269             'spec': tn/(tn+fp)}
270
271 # Compute scores
272 scores = [metrics(y_test, y_prob[:,1], t) \
273     for t in thresholds]
274
275 # Create DataFrame
276 results = pd.DataFrame(scores)
277
278 # Find idx where npv is closest to 0.8
279 idx = np.nanargmin(np.abs(results.npv - 0.8))
280
281 # Show
282 print("\n\nResults from manual")
283 print(results)
284
285 # Display graph
286 display_npv_ppv_curve(
287     results.ppv,
288     results.npv,
289     results.th,
290     idx)
291
292 # Title
293 plt.suptitle("From 'manual thresholds'")
294
295 # Show
296 plt.show()
Total running time of the script: ( 0 minutes 0.506 seconds)


