Note
Click here to download the full example code
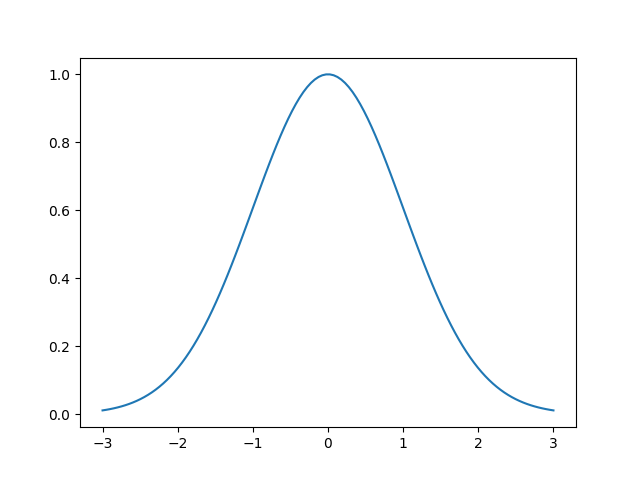
Plotting a gaussian (tutorial)
Example matplotlib to plot a gaussian.
Let’s import numpy and matplotlib
10 11 | import numpy as np
import matplotlib.pyplot as plt
|
Methods
First, lets define the gaussian method
19 20 | def gaussian(x, mu=0, sig=1):
return np.exp(-np.power(x - mu, 2.) / (2 * np.power(sig, 2.)))
|
Main
Lets create the x and y values
28 29 | x = np.linspace(-3, 3, 120)
y = gaussian(x)
|
Lets plot using matplotlib
33 34 | plt.plot(x, y)
plt.show()
|
Total running time of the script: ( 0 minutes 0.091 seconds)